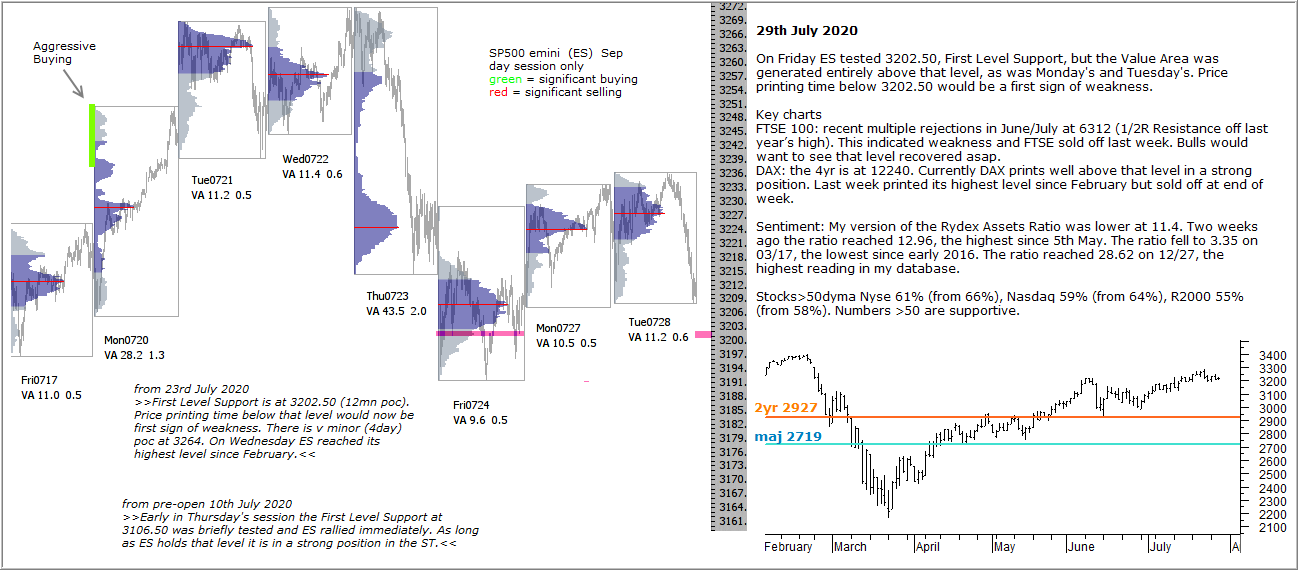
On Friday ES tested 3202.50, First Level Support, but the Value Area was generated entirely above that level, as was Monday’s and Tuesday’s. Price printing time below 3202.50 would be a first sign of weakness.
Key charts
FTSE 100: recent multiple rejections in June/July at 6312 (1/2R Resistance off last year’s high). This indicated weakness and FTSE sold off last week. Bulls would want to see that level recovered asap.
DAX: the 4yr is at 12240. Currently DAX prints well above that level in a strong position. Last week printed its highest level since February but sold off at end of week.
Sentiment: My version of the Rydex Assets Ratio was lower at 11.4. Two weeks ago the ratio reached 12.96, the highest since 5th May. The ratio fell to 3.35 on 03/17, the lowest since early 2016. The ratio reached 28.62 on 12/27, the highest reading in my database.
Stocks>50dyma Nyse 61% (from 66%), Nasdaq 59% (from 64%), R2000 55% (from 58%). Numbers >50 are supportive.