SP500 emini 31st March 2020 – from ChartProfit
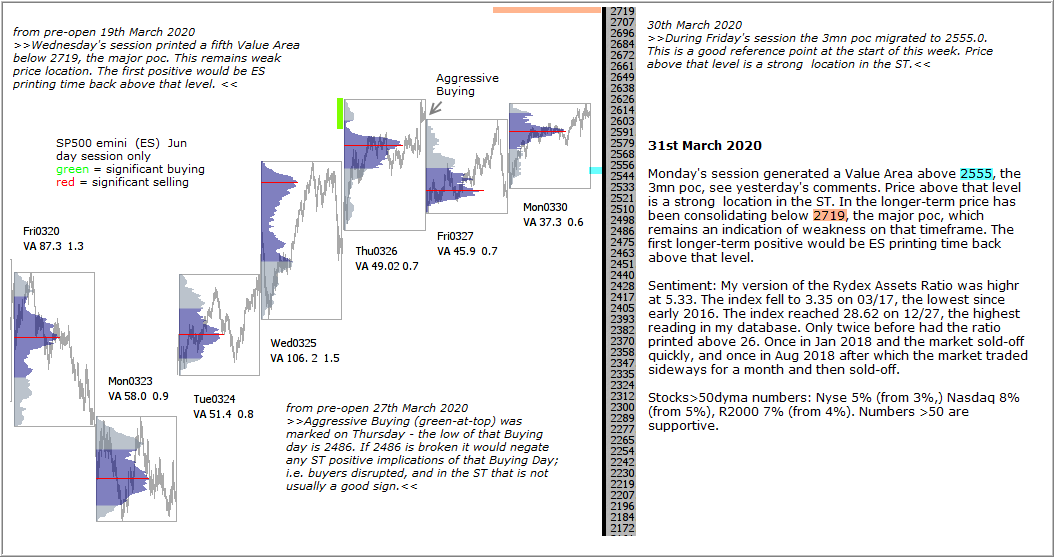
Monday’s session generated a Value Area above 2555, the 3mn poc, see yesterday’s comments. Price above that level is a strong location in the ST. In the longer-term price has been consolidating below 2719, the major poc, which remains an indication of weakness on that timeframe. The first longer-term positive would be ES printing time back above that level.
Sentiment: My version of the Rydex Assets Ratio was higher at 5.33. The index fell to 3.35 on 03/17, the lowest since early 2016. The index reached 28.62 on 12/27, the highest reading in my database. Only twice before had the ratio printed above 26. Once in Jan 2018 and the market sold-off quickly, and once in Aug 2018 after which the market traded sideways for a month and then sold-off.
Stocks>50dyma numbers: Nyse 5% (from 3%,) Nasdaq 8% (from 5%), R2000 7% (from 4%). Numbers >50 are supportive.