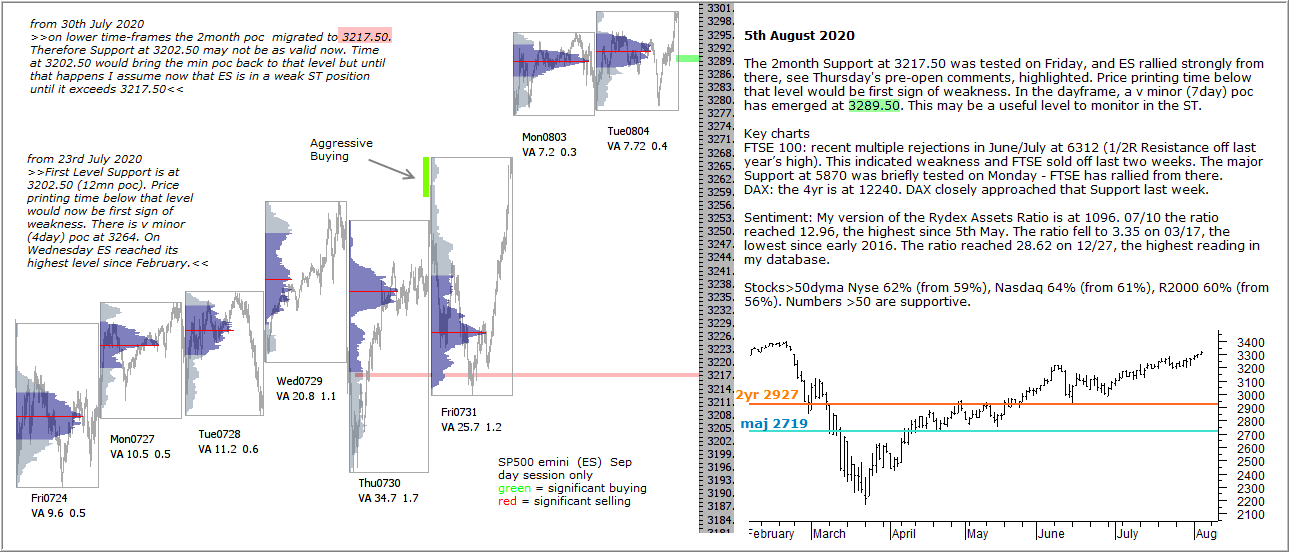
The 2month Support at 3217.50 was tested on Friday, and ES rallied strongly from there, see Thursday’s pre-open comments, highlighted. Price printing time below that level would be first sign of weakness. In the dayframe, a v minor (7day) poc has emerged at 3289.50. This may be a useful level to monitor in the ST.
Key charts
FTSE 100: recent multiple rejections in June/July at 6312 (1/2R Resistance off last year’s high). This indicated weakness and FTSE sold off last two weeks. The major Support at 5870 was briefly tested on Monday – FTSE has rallied from there.
DAX: the 4yr is at 12240. DAX closely approached that Support last week.
Sentiment: My version of the Rydex Assets Ratio is at 1096. 07/10 the ratio reached 12.96, the highest since 5th May. The ratio fell to 3.35 on 03/17, the lowest since early 2016. The ratio reached 28.62 on 12/27, the highest reading in my database.
Stocks>50dyma Nyse 62% (from 59%), Nasdaq 64% (from 61%), R2000 60% (from 56%). Numbers >50 are supportive.