Updating the post Relative Strength Index diverging on Weekly Charts published 1st October.
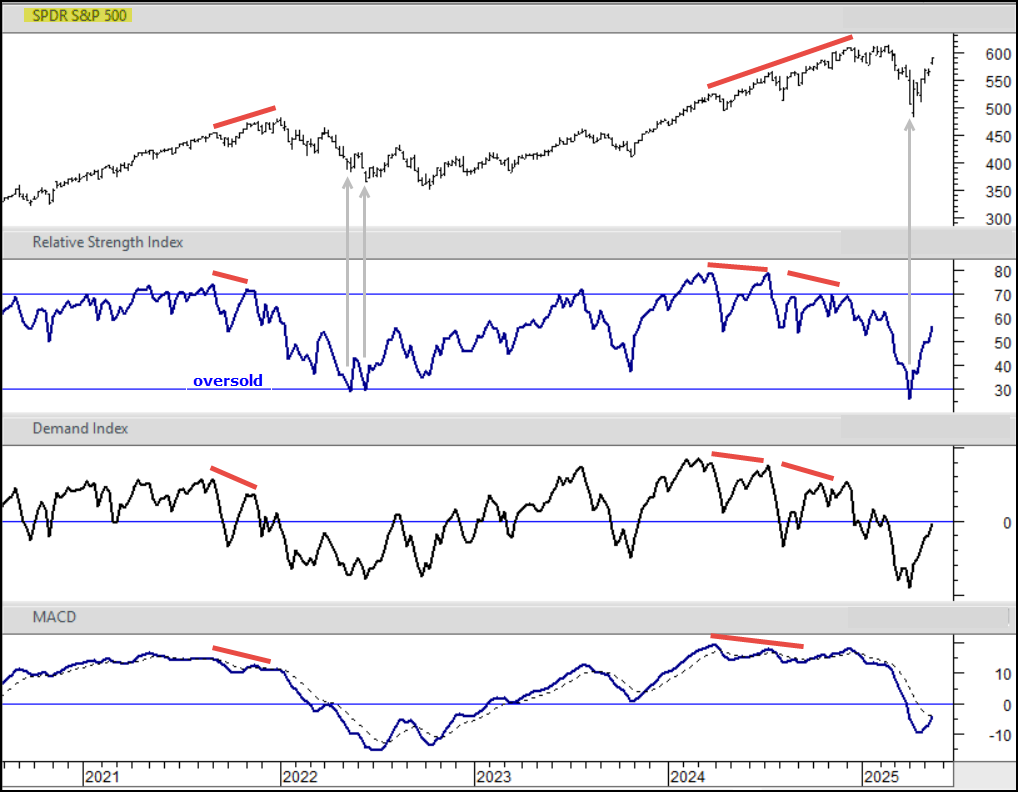
Updated chart below. The first ‘divergent’ lower high on the oscillators was in the middle of 2024 and preceded a mild sell-off. You had to wait more than 6 months for the ‘big one’ and would have missed the rally in that period if you were waiting for the ‘reset’ to RSI<30. Got it eventually though.