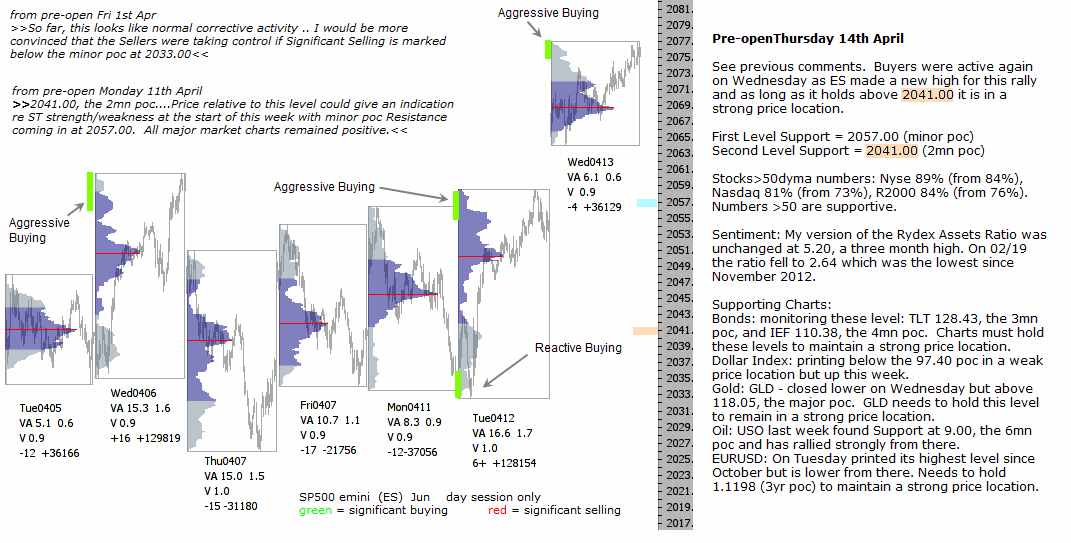
Technical analysis – Market pre-open 14th April 2016
See previous comments. Buyers were active again on Wednesday as ES made a new high for this rally and as long as it holds above 2041.00 it is in a strong price location.
First Level Support = 2057.00 (minor poc)
Second Level Support = 2041.00 (2mn poc)
Stocks>50dyma numbers: Nyse 89% (from 84%), Nasdaq 81% (from 73%), R2000 84% (from 76%). Numbers >50 are supportive.
Sentiment: My version of the Rydex Assets Ratio was unchanged at 5.20, a three month high. On 02/19 the ratio fell to 2.64 which was the lowest since November 2012.
Supporting Charts:
Bonds: monitoring these level: TLT 128.43, the 3mn poc, and IEF 110.38, the 4mn poc. Charts must hold these levels to maintain a strong price location.
Dollar Index: printing below the 97.40 poc in a weak price location but up this week.
Gold: GLD – closed lower on Wednesday but above 118.05, the major poc. GLD needs to hold this level to remain in a strong price location.
Oil: USO last week found Support at 9.00, the 6mn poc and has rallied strongly from there.
EURUSD: On Tuesday printed its highest level since October but is lower from there. Needs to hold 1.1198 (3yr poc) to maintain a strong price location.