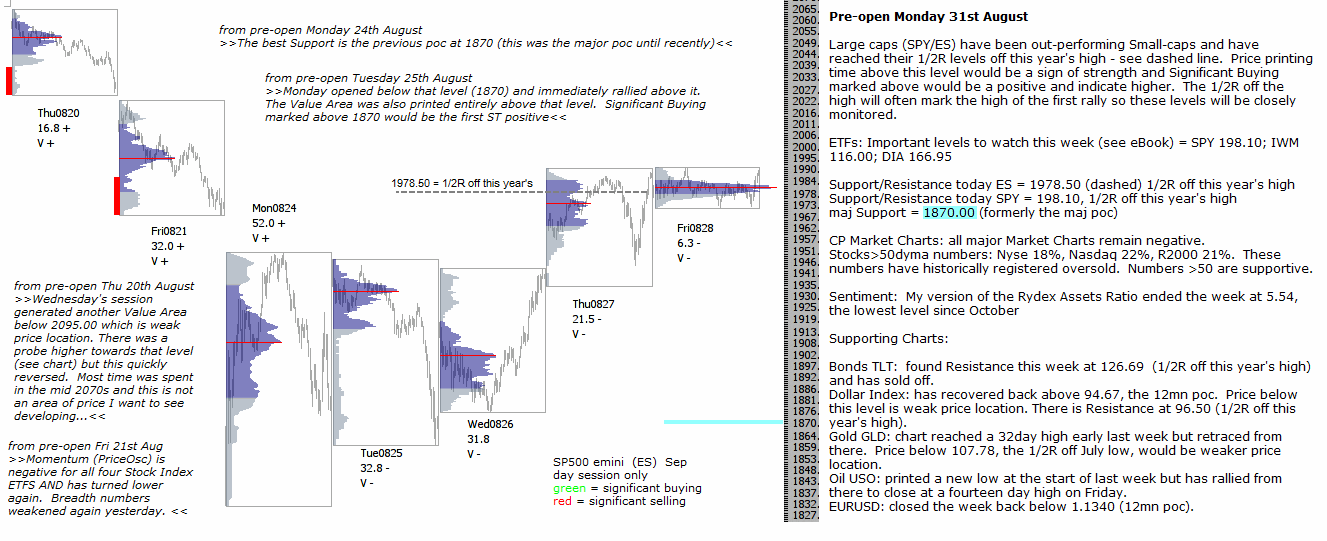
Technical Analysis S&P 500 emini pre-open 31st August
Large caps (SPY/ES) have been out-performing Small-caps and have reached their 1/2R levels off this year’s high – see dashed line. Price printing time above this level would be a sign of strength and Significant Buying marked above would be a positive and indicate higher. The 1/2R off the high will often mark the high of the first rally so these levels will be closely monitored.
ETFs: Important levels to watch this week (see eBook) = SPY 198.10; IWM 116.00; DIA 166.95
Support/Resistance today ES = 1978.50 (dashed) 1/2R off this year’s high
Support/Resistance today SPY = 198.10, 1/2R off this year’s high
maj Support = 1870.00 (formerly the maj poc)
CP Market Charts: all major Market Charts remain negative.
Stocks>50dyma numbers: Nyse 18%, Nasdaq 22%, R2000 21%. These numbers have historically registered oversold. Numbers >50 are supportive.
Sentiment: My version of the Rydex Assets Ratio ended the week at 5.54, the lowest level since October
Supporting Charts:
Bonds TLT: found Resistance this week at 126.69 (1/2R off this year’s high) and has sold off.
Dollar Index: has recovered back above 94.67, the 12mn poc. Price below this level is weak price location. There is Resistance at 96.50 (1/2R off this year’s high).
Gold GLD: chart reached a 32day high early last week but retraced from there. Price below 107.78, the 1/2R off July low, would be weaker price location.
Oil USO: printed a new low at the start of last week but has rallied from there to close at a fourteen day high on Friday.
EURUSD: closed the week back below 1.1340 (12mn poc).