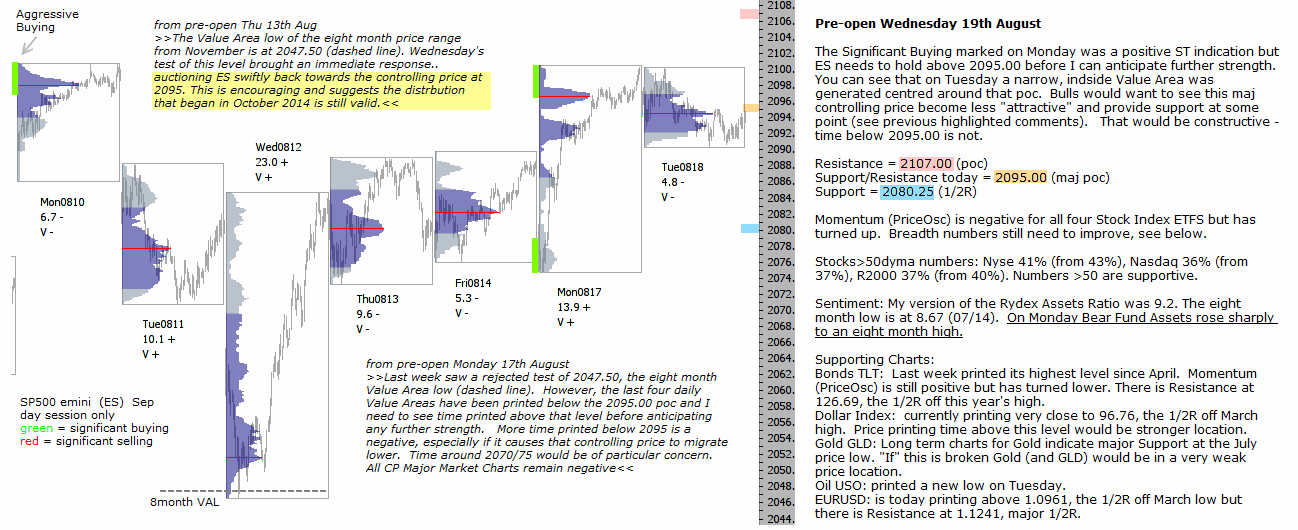
Technical analysis S&P 500 emini Wednesday 19th August 2015.
The Significant Buying marked on Monday was a positive ST indication but ES needs to hold above 2095.00 before I can anticipate further strength. You can see that on Tuesday a narrow, indside Value Area was generated centred around that poc. Bulls would want to see this maj controlling price become less “attractive” and provide support at some point (see previous highlighted comments). That would be constructive – time below 2095.00 is not.
Resistance = 2107.00 (poc)
Support/Resistance today = 2095.00 (maj poc)
Support = 2080.25 (1/2R)
Momentum (PriceOsc) is negative for all four Stock Index ETFS but has turned up. Breadth numbers still need to improve, see below.
Stocks>50dyma numbers: Nyse 41% (from 43%), Nasdaq 36% (from 37%), R2000 37% (from 40%). Numbers >50 are supportive.
Sentiment: My version of the Rydex Assets Ratio was 9.2. The eight month low is at 8.67 (07/14). On Monday Bear Fund Assets rose sharply to an eight month high.