ChartProfit Chart Book – week ending 11th June 2021 … [Continue reading]
emini SP500 11th June 2021
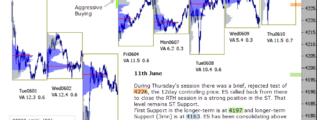
During Thursday's session there was a brief, rejected test of 4226, the 12day controlling price. ES rallied back from there to close the RTH session in a strong position in the ST. That level remains ST Support.First Support in the longer-term is at … [Continue reading]
emini SP500 10th June 2021
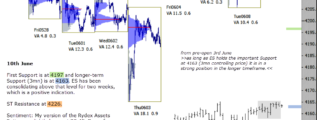
First Support is at 4197 and longer-term Support (3mn) is at 4163. ES has been consolidating above that level for two weeks, which is a positive indication. ST Resistance at 4226. Sentiment: My version of the Rydex Assets Ratio was slightly … [Continue reading]
emini SP500 9th June 2021
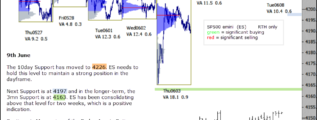
The 10day Support has moved to 4226. ES needs to hold this level to maintain a strong position in the dayframe. Next Support is at 4197 and in the longer-term, the 3mn Support is at 4163. ES has been consolidating above that level for two weeks, … [Continue reading]
emini ES SP500 8th June 2021
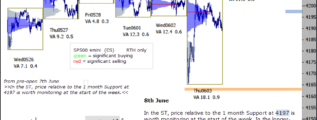
In the ST, price relative to the 1 month Support at 4197 is worth monitoring at the start of the week. In the longer-term, as long as ES holds the 3mn Support at 4163 it is in a strong position. ES has been consolidating above that level for two … [Continue reading]
emini SP500 7th June 2021
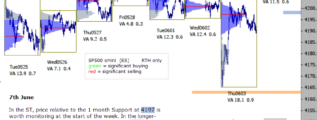
In the ST, price relative to the 1 month Support at 4197 is worth monitoring at the start of the week. In the longer-term, as long as ES holds the 3mn Support at 4163 it is in a strong position. ES has been consolidating above that level for two … [Continue reading]
Protected: ChartProfit Chart Book – week ending 4th June 2021
This content is password-protected. To view it, please enter the password below. Password: … [Continue reading]
emini SP500 4th June 2021
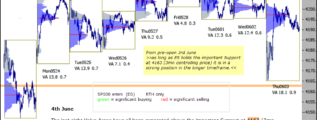
The last eight Value Areas have all been generated above the important Support at 4163 (3mn controlling price) and, as I wrote yesterday, as long as ES holds this level it is in a strong position in the longer timeframe. Sentiment: My version of … [Continue reading]
emini ES 3rd June 2021
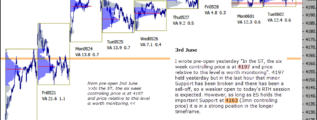
I wrote pre-open yesterday "In the ST, the six week controlling price is at 4197 and price relative to this level is worth monitoring". 4197 held yesterday but in the last hour that minor Support has been broken and there has been a sell-off, so a … [Continue reading]
emini SP500 2nd June 2021
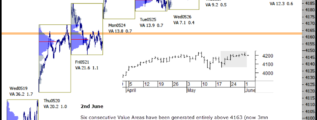
Six consecutive Value Areas have been generated entirely above 4163 (now 3mn controlling price) which is an indication of strength. ES has been consolidating above that important Support. In the ST, the six week controlling price is at 4197 and price … [Continue reading]
- « Previous Page
- 1
- …
- 102
- 103
- 104
- 105
- 106
- …
- 556
- Next Page »