• Home

chartprofit.com

Daily analysis - Stock Market, Bonds, Forex and more

emini SP500 24th August 2021

Posted on August 24, 2021 Written by Chart Prophet

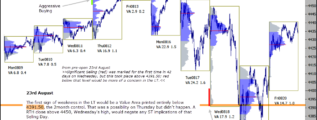
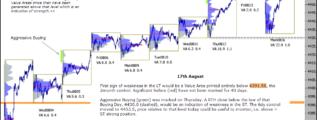
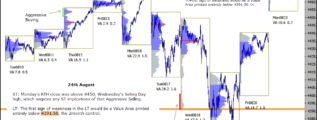
ST: Monday's RTH close was above 4450, Wednesday's Selling Day high, which negates any ST implications of that Aggressive Selling. LT: The first sign of weakness in the LT would be a Value Area printed entirely below 4391.50, the 2month … [Continue reading]

Filed Under: emini SP500 (ES)

emini SP500 23rd August 2021

Posted on August 23, 2021 Written by Chart Prophet

The first sign of weakness in the LT would be a Value Area printed entirely below 4391.50, the 2month control. That was a possibility on Thursday but didn't happen. A RTH close above 4450, Wednesday's high, would negate any ST implications of that … [Continue reading]

Filed Under: emini SP500 (ES)

ChartProfit Chart Book week ending 20th August 2021

Posted on August 22, 2021 Written by Chart Prophet

ChartProfit Chart Book – week ending 20th August 2021 … [Continue reading]

Filed Under: emini SP500 (ES)

emini SP500 20th August 2021

Posted on August 20, 2021 Written by Chart Prophet

I've been writing that "First sign of weakness in the LT would be a Value Area printed entirely below 4391.50, the 2month control". That was a possibility yesterday but didn't happen. Significant Selling (red) was marked for the first time in 42 days … [Continue reading]

Filed Under: emini SP500 (ES)

emini SP500 19th August 2021

Posted on August 19, 2021 Written by Chart Prophet

I've been writing that "First sign of weakness in the LT would be a Value Area printed entirely below 4391.50, the 2month control". That is a possibility today with ES printing below 4360 pre-open. Significant Selling (red) was marked for the first … [Continue reading]

Filed Under: emini SP500 (ES)

emini SP500 18th August 2021

Posted on August 18, 2021 Written by Chart Prophet

First sign of weakness in the LT would be a Value Area printed entirely below 4391.50, the 2month control. Significant Sellers (red) have not been marked for 41 days. Tuesday's RTH found Resistance at 4453.50, the 6dy control, see yesterday's … [Continue reading]

Filed Under: emini SP500 (ES)

emini SP500 17th August 2021

Posted on August 17, 2021 Written by Chart Prophet

First sign of weakness in the LT would be a Value Area printed entirely below 4391.50, the 2month control. Significant Sellers (red) have not been marked for 40 days. Aggressive Buying (green) was marked on Thursday. A RTH close below the low of … [Continue reading]

Filed Under: emini SP500 (ES)

emini SP500 16th August 2021

Posted on August 16, 2021 Written by Chart Prophet

First sign of weakness in the LT would be a Value Area printed entirely below 4391.50, the 2month control. Significant Sellers (red) have not been marked for 39 days. Aggressive Buying (green) was marked on Thursday. A RTH close below the low of … [Continue reading]

Filed Under: emini SP500 (ES)

ChartProfit Chart Book week ending 13th August 2021

Posted on August 15, 2021 Written by Chart Prophet

ChartProfit Chart Book – week ending 13th August 2021 … [Continue reading]

Filed Under: emini SP500 (ES)

emini SP500 13th August 2021

Posted on August 13, 2021 Written by Chart Prophet

08/04 RTH found Support at 4391.50 (the 2mn controlling price). Value Areas since then have been generated above that level - I've been writing that that's an indication of strength. First sign of weakness in the LT would be a Value Area printed … [Continue reading]

Filed Under: emini SP500 (ES)

  • « Previous Page
  • 1
  • …
  • 103
  • 104
  • 105
  • 106
  • 107
  • …
  • 562
  • Next Page »

Archives

Copyright © 2026 · Focus Pro Theme on Genesis Framework · WordPress · Log in