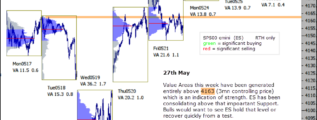
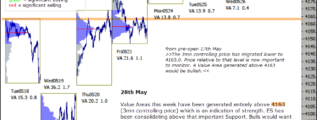
• Home

chartprofit.com

Daily analysis - Stock Market, Bonds, Forex and more

emini SP500 7th Oct 2020

Posted on October 7, 2020 Written by Chart Prophet

Most of Tuesday's session was spent above the 3387 Resistance (dashed line). Unfortunately, late in the day there was a sharp sell-off on news and ES closed below the 3370.50 poc, which is a weaker position. The session close was also below the low … [Continue reading]

Filed Under: emini SP500 (ES)

emini SP500 6th Oct 2020

Posted on October 6, 2020 Written by Chart Prophet

Last week's high came in at the 3387 Resistance (dashed line) but that has now been exceeded. Monday's Value Area was generated above the 3370.5 poc and Aggressive Buying was marked. These are all positives. A Value Area above 3387 would be the next … [Continue reading]

Filed Under: emini SP500 (ES)

emini SP500 5th Oct 2020

Posted on October 5, 2020 Written by Chart Prophet

Last week's high came in at the 3387 Resistance (dashed line). Pre-open Thursday I wrote "A Value Area above 3387 would be the next positive to look for and confirm the Buyers are back in control", (highlighted above). This clearly hasn't happened … [Continue reading]

Filed Under: emini SP500 (ES)

ChartProfit Chart Book 2nd Sep 2020

Posted on October 4, 2020 Written by Chart Prophet

ChartProfit Chart Book - week ending 2nd October 2020 … [Continue reading]

Filed Under: emini SP500 (ES)

emini SP500 2nd Oct 2020

Posted on October 2, 2020 Written by Chart Prophet

Thursday's session high came in at the 3387 Resistance, see yesterday's highlighted comments. With the sell-off on news overnight, ES is printing below 3342.5, the minor poc and is in a weaker position. I wrote yesterday "A Value Area above 3387 … [Continue reading]

Filed Under: emini SP500 (ES)

emini SP500 1st October 2020

Posted on October 1, 2020 Written by Chart Prophet

Read yesterday's highlighted comments on chart. The minor poc has migrated slightly to 3342.5. As long as ES holds above that level it could be ready to make a directional move higher. Pre-open the high has been 3388 which is above the 3370.5 poc. … [Continue reading]

Filed Under: emini SP500 (ES)

emini SP500 30th Sep 2020

Posted on September 30, 2020 Written by Chart Prophet

… [Continue reading]

Filed Under: emini SP500 (ES)

emini SP500 29th Sep 2020

Posted on September 29, 2020 Written by Chart Prophet

Pre-open on 09/21 I identified 3220 as an area of Support. That held last week (+), see Value Areas. Significant Buying was marked twice (+). Monday's Value Area was higher than any last week (+). Despite the positives I would want to see at least a … [Continue reading]

Filed Under: emini SP500 (ES)

emini SP500 28th Sep 2020

Posted on September 28, 2020 Written by Chart Prophet

Pre-open on 09/21 I identified 3220 as an area of Support. That held last week, see Value Areas. Significant Buying was marked twice. Pre-open today ES prints above 3330. Time below that Support, now proven, would indicate further … [Continue reading]

Filed Under: emini SP500 (ES)

ChartProfit Chart Book 25th September 2020

Posted on September 27, 2020 Written by Chart Prophet

ChartProfit Chart Book - week ending 25th September 2020 … [Continue reading]

Filed Under: emini SP500 (ES)

  • « Previous Page
  • 1
  • …
  • 103
  • 104
  • 105
  • 106
  • 107
  • …
  • 538
  • Next Page »

Archives

Copyright © 2025 · Focus Pro Theme on Genesis Framework · WordPress · Log in