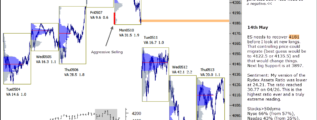
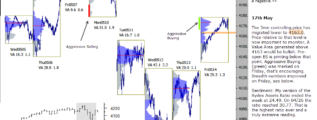
• Home

chartprofit.com

Daily analysis - Stock Market, Bonds, Forex and more

SP500 emini 25th Sep 2020

Posted on September 25, 2020 Written by Chart Prophet

Please read yesterday's highlighted comments. This week there has been brief tests of the 3220 area of Support but Value Areas have been generated above that level. Price below that, now proven, Support would indicate further weakness. Pre-open today … [Continue reading]

Filed Under: emini SP500 (ES)

emini ES 24th September 2020

Posted on September 24, 2020 Written by Chart Prophet

On 3rd Sep, there was a day session close below the low of the previous day which was a Buying Day. I call this a "disruption" for the Buyers and it often leads to further weakness. Same thing happened yesterday, with a close below Tuesday's Buying … [Continue reading]

Filed Under: emini SP500 (ES)

emini SP500 23rd September 2020

Posted on September 23, 2020 Written by Chart Prophet

The 3220 area of Support held up well on Monday, see Monday's pre-open comments, highlighted. Bulls would want to see that level hold. Tuesday's session generated a higher Value Area and Significant Buying (green) was marked. That's encouraging but … [Continue reading]

Filed Under: emini SP500 (ES)

emini ES 22nd September 2020

Posted on September 22, 2020 Written by Chart Prophet

The 3220 area of Support held up well yesterday, see yesterday's pre-open comments, highlighted. Bulls would want to see that level hold but new longs still eliminated, at least until Significant Buying is marked again. Price below 3220 would further … [Continue reading]

Filed Under: emini SP500 (ES)

emini SP500 21st September 2020

Posted on September 21, 2020 Written by Chart Prophet

Like Thursday, Friday's Value Area was generated below the 3370.5 poc. Also on Friday, Aggressive Selling was marked, see previous comments highlighted on chart. Overnight and pre-open today, ES has declined sharply. 3220 may be an area of Support … [Continue reading]

Filed Under: emini SP500 (ES)

ChartProfit Chart Book 18th September 2020

Posted on September 20, 2020 Written by Chart Prophet

ChartProfit Chart Book - week ending 18th September 2020 … [Continue reading]

Filed Under: emini SP500 (ES)

ES emini SP500 18th September

Posted on September 18, 2020 Written by Chart Prophet

Thursday's Value Area was generated back below the 3370.5 poc, see pre-open comments 10th Sep, highlighted on chart. ES is in a weaker position below the poc but appears to be oscillating around it. Price action like this often results in a migration … [Continue reading]

Filed Under: emini SP500 (ES)

emini ES 17th September 2020

Posted on September 17, 2020 Written by Chart Prophet

Value Areas this week have been generated back above the 3370.5 poc which was encouraging but I wrote pre-open last Thursday we need to see "Significant Buying (green) marked above that level to consider new longs". Following the Fed announcement, ES … [Continue reading]

Filed Under: emini SP500 (ES)

ES emini 16th September 2020

Posted on September 16, 2020 Written by Chart Prophet

Value Areas on Monday and Tuesday were generated back above the 3370.5 poc. That's a stonger position. As I wrote pre-open Thursday we need to see "Significant Buying (green) marked above that level to consider new longs". Markets are waiting for the … [Continue reading]

Filed Under: emini SP500 (ES)

ES emini 15th September 2020

Posted on September 15, 2020 Written by Chart Prophet

Monday's Value Area was generated back above the 3370.5 poc. That's a stonger position. As I wrote pre-open Thursday we need to see "Significant Buying (green) marked above that level to consider new longs". Stocks>50dyma Nyse 56% (from 48%), … [Continue reading]

Filed Under: emini SP500 (ES)

  • « Previous Page
  • 1
  • …
  • 104
  • 105
  • 106
  • 107
  • 108
  • …
  • 538
  • Next Page »

Archives

Copyright © 2025 · Focus Pro Theme on Genesis Framework · WordPress · Log in