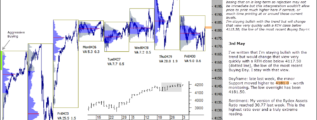
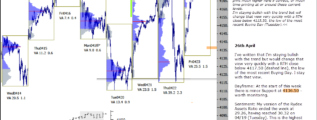
• Home

chartprofit.com

Daily analysis - Stock Market, Bonds, Forex and more

ES emini 15th September 2020

Posted on September 15, 2020 Written by Chart Prophet

Monday's Value Area was generated back above the 3370.5 poc. That's a stonger position. As I wrote pre-open Thursday we need to see "Significant Buying (green) marked above that level to consider new longs". Stocks>50dyma Nyse 56% (from 48%), … [Continue reading]

Filed Under: emini SP500 (ES)

emini SP500 14th September 2020

Posted on September 14, 2020 Written by Chart Prophet

Friday's Value Area was generated entirely below the 3370.5 poc. That's a weak position. As I wrote pre-open Thursday we need to see "Significant Buying (green) marked above that level to consider new longs". Pre-open today ES prints just below the … [Continue reading]

Filed Under: emini SP500 (ES)

ChartProfit Chart Book 11th September 2020

Posted on September 12, 2020 Written by Chart Prophet

ChartProfit Chart Book - week ending 11th September 2020 … [Continue reading]

Filed Under: emini SP500 (ES)

emini 11th September 2020

Posted on September 11, 2020 Written by Chart Prophet

See yesterday's highlighted comments on chart. Intraday on Thursday ES found Support at 3370.5 but a decline below that level into the session close left ES near the lows for this weeks sell-off. As I wrote pre-open yesterday we need to see … [Continue reading]

Filed Under: emini SP500 (ES)

emini SP500 10th September 2020

Posted on September 10, 2020 Written by Chart Prophet

See yesterday's comments highlighted on chart. ES opened the session just below the 3370.5 poc and rallied immediately generating a Value Area entirely above that level. That's encouraging but need Significant Buying (green) marked above that level … [Continue reading]

Filed Under: emini SP500 (ES)

emini SP500 9th September 2020

Posted on September 9, 2020 Written by Chart Prophet

Sharp sell-off last Thursday. Friday bounced back but generated a lower Value Area. Tuesday's VA was lower again and was generated below the 3370.50 Support, see yesterday's highlighted comments on chart. Bulls would want to see 3370.50 recovered … [Continue reading]

Filed Under: emini SP500 (ES)

emini 8th September 2020

Posted on September 8, 2020 Written by Chart Prophet

Sharp sell-off on Thursday and Friday generated a lower Value Area. As I wrote pre-open Friday "There is Support at the 3370.50 poc but it is relatively minor". That Support was briefly tested but Friday's VA was almost entirely above that level. A … [Continue reading]

Filed Under: emini SP500 (ES)

ChartProfit Chart Book 4th September 2020

Posted on September 6, 2020 Written by Chart Prophet

ChartProfit Chart Book - week ending 4th September 2020 … [Continue reading]

Filed Under: emini SP500 (ES)

emini SP500 4th September 2020

Posted on September 4, 2020 Written by Chart Prophet

See yesterday's pre-open comments, highlighted on chart. I wrote >>Market "may" be in an acceleration move into a top, therefore I have moved a trading stop (daily time-frame) to a day-session close below 3534 which is the low of yesterday's … [Continue reading]

Filed Under: emini SP500 (ES)

Pulse Chart Update

Posted on September 3, 2020 Written by Chart Prophet

In the pre-open report today I wrote that a trading stop (daily time-frame) was now in place which is a day-session close below 3534, the low of yesterday's Aggressive Buying day. See Green bars on Pulse Chart below which represent Aggressive Buying … [Continue reading]

Filed Under: emini SP500 (ES)

  • « Previous Page
  • 1
  • …
  • 105
  • 106
  • 107
  • 108
  • 109
  • …
  • 538
  • Next Page »

Archives

Copyright © 2025 · Focus Pro Theme on Genesis Framework · WordPress · Log in