• Home

chartprofit.com

Daily analysis - Stock Market, Bonds, Forex and more

emini 7th July 2020

Posted on July 7, 2020 Written by Chart Prophet

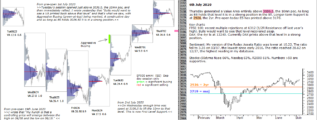
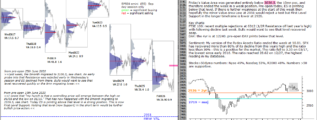
Last two Value Areas have been generated above 3106.5, the 10mn poc. As long as ES holds that level it is in a strong position in the ST. Longer-term Support is at 2926, the 2yr. Key charts FTSE 100: recent multiple rejections at 6312 (1/2R … [Continue reading]

Filed Under: emini SP500 (ES)

emini in strong position

Posted on July 6, 2020 Written by Chart Prophet

Thursday generated a Value Area entirely above 3106.5, the 10mn poc. As long as ES holds that level it is in a strong position in the ST. Longer-term Support is at 2926, the 2yr. Pre-open today ES has printed above 3170. Key charts FTSE 100: … [Continue reading]

Filed Under: emini SP500 (ES)

emini higher at open

Posted on July 2, 2020 Written by Chart Prophet

ES has opened higher today. See yesterday's pre-open comments, highlighted on chart. On Wednesday enough time was spent at 3106.5 to lift the 10mn to that level. This is now First Level Support. Key charts FTSE 100: recent multiple rejections at … [Continue reading]

Filed Under: emini SP500 (ES)

emini SP500 1st July 2020

Posted on July 1, 2020 Written by Chart Prophet

Tuesday's session opened just above 3036.5, the 10mn poc, and then immediately rallied. I wrote yesterday that "Bulls would want to see a VA printed back above that level" and that's what we saw, with Aggressive Buying (green-at-top) being marked. A … [Continue reading]

Filed Under: emini SP500 (ES)

emini SP500 30th June 2020

Posted on June 30, 2020 Written by Chart Prophet

Last two Value Areas have been generated below 3036.5, the 10mn poc, = weak position. Bulls would want to see a VA printed back above that level. If there is further weakness this week then hopefully the minor Value Area Low at 2951 would reject a … [Continue reading]

Filed Under: emini SP500 (ES)

emini SP500 29th June 2020

Posted on June 29, 2020 Written by Chart Prophet

Friday's Value Area was generated entirely below 3036.5, the 10mn poc, and therefore ended the week in a weak position. Pre-open today, ES is printing below that level. If there is further weakness at the start of this week then hopefully the minor … [Continue reading]

Filed Under: emini SP500 (ES)

Chartprofit Chart Book 26th June 2020

Posted on June 28, 2020 Written by Chart Prophet

ChartProfit Chart Book - week ending 26th June 2020 … [Continue reading]

Filed Under: emini SP500 (ES)

SP500 emini minor poc migrated again

Posted on June 26, 2020 Written by Chart Prophet

The minor poc (now 10mn) has migrated lower with Thursday's price action, see yesterday's highlighted comments. ES is currently printing above that level, and needs to hold it to remain in a strong position. First Level Support in the longer … [Continue reading]

Filed Under: emini SP500 (ES)

SP500 emini Resistance in play on Wednesday

Posted on June 25, 2020 Written by Chart Prophet

Last week, the 8month migrated to 3106.5, see chart. An early probe into that Resistance was rejected early in Wednesday's session and ES declined from there. Bulls would want to see that level recovered quickly or the 8mn migrating lower. First … [Continue reading]

Filed Under: emini SP500 (ES)

emini SP500 24th June 2020

Posted on June 24, 2020 Written by Chart Prophet

Last week, the 8month migrated to 3106.5, see chart. Today emini SP500 is printing back below that level in a weaker position. Bulls would want to see that level recovered quickly. Key charts FTSE 100: upside last seven days has been capped at … [Continue reading]

Filed Under: emini SP500 (ES)

  • « Previous Page
  • 1
  • …
  • 111
  • 112
  • 113
  • 114
  • 115
  • …
  • 539
  • Next Page »

Archives

Copyright © 2025 · Focus Pro Theme on Genesis Framework · WordPress · Log in