• Home

chartprofit.com

Daily analysis - Stock Market, Bonds, Forex and more

emini 13th April 2021

Posted on April 13, 2021 Written by Chart Prophet

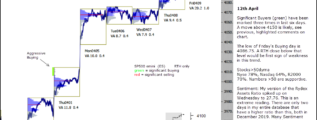
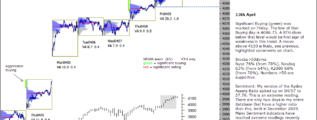
Significant Buying (green) was marked on Friday. The low of that Buying day is 4086.75. A RTH close below that level would be first sign of weakness in this trend. A move above 4150 is likely, see previous, highlighted comments on … [Continue reading]

Filed Under: emini SP500 (ES) Tagged With: e-mini, emini, ES_F

e-mini 12th April 2021

Posted on April 12, 2021 Written by Chart Prophet

Significant Buyers (green) have been marked three times in last six days. A move above 4150 is likely, see previous, highlighted comments on chart. The low of Friday's Buying day is 4086.75. A RTH close below that level would be first sign of … [Continue reading]

Filed Under: emini SP500 (ES) Tagged With: emini, ES_F

ChartProfit Chart Book week-ending 9th April 2021

Posted on April 11, 2021 Written by Chart Prophet

ChartProfit Chart Book - week ending 9th April 2021 … [Continue reading]

Filed Under: Market Sentiment Tagged With: AAII, Investors intelligence, NAAIM

ES_F 9th April 2021

Posted on April 9, 2021 Written by Chart Prophet

The distribution patterns suggest a move above 4150 but rejection above that level would be likely. Price back below 3897, the 7-month Support, would indicate a change in trend in the longer time-frame. Stocks>50dymaNyse 79% (unch), Nasdaq 65% … [Continue reading]

Filed Under: emini SP500 (ES) Tagged With: e-mini, emini, ES_F

e-mini 8th April 2021

Posted on April 8, 2021 Written by Chart Prophet

On 03/26 a Value Area was generated back above 3897. This represented a rejected test of that controlling price in the longer time-frame which is often a bullish pattern. As long as 3897 holds the distribution patterns suggest a move above 4150 but … [Continue reading]

Filed Under: emini SP500 (ES) Tagged With: e-mini, ES_F

e-mini 7th April 2021

Posted on April 7, 2021 Written by Chart Prophet

On 03/26 a Value Area was generated back above 3897. This represented a rejected test of that controlling price in the longer time-frame which is often a bullish pattern. As long as 3897 holds the distribution patterns suggest a move above 4150 but … [Continue reading]

Filed Under: emini SP500 (ES) Tagged With: e-mini, emini, ES_F

e-mini 6th April 2021

Posted on April 6, 2021 Written by Chart Prophet

On 03/26 a Value Area was generated back above 3897. This represented a rejected test of that controlling price in the longer time-frame which is often a bullish pattern. As long as 3897 holds the distribution patterns suggest a move above 4150 but … [Continue reading]

Filed Under: emini SP500 (ES) Tagged With: e-mini, ES_F

e-mini SP500 5th April 2021

Posted on April 5, 2021 Written by Chart Prophet

On 03/26 a Value Area was generated back above 3897. This represented a rejected test of that controlling price in the longer time-frame which is often a bullish pattern, see previous, highlighted comment on chart. Price back below 3897 from here … [Continue reading]

Filed Under: emini SP500 (ES) Tagged With: emini, ES, ES_F

ChartProfit Chart Book week-ending 2nd April 2021

Posted on April 3, 2021 Written by Chart Prophet

ChartProfit Chart Book - week ending 2nd April 2021 … [Continue reading]

Filed Under: emini SP500 (ES)

e-mini 1st April 2021

Posted on April 1, 2021 Written by Chart Prophet

Last four Value Areas generated back above 3897, the 7 month controlling price, which is First Level Support. Strong position if that level holds. Stocks>50dymaNyse 74% (from 75%), Nasdaq 56% (from 54%), R2000 65% (from 64%). Numbers >50 are … [Continue reading]

Filed Under: emini SP500 (ES)

  • « Previous Page
  • 1
  • …
  • 113
  • 114
  • 115
  • 116
  • 117
  • …
  • 562
  • Next Page »

Archives

Copyright © 2026 · Focus Pro Theme on Genesis Framework · WordPress · Log in