ChartProfit Chart Book - week ending 28th August 2020 … [Continue reading]
emini SP500 28th August 2020
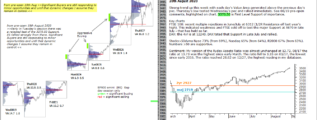
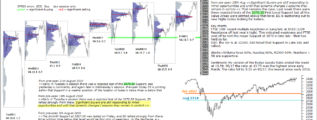
Strong trend up this week with each day's Value Area generated above the previous day's poc. Thursday's low tested Wednesday's poc and rallied immediately. See 08/19 pre-open comments, highlighted on chart. 3370.50 is First Level Support of … [Continue reading]
SP500 emini 27th August 2020
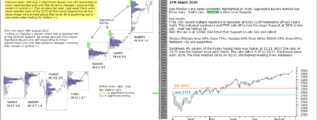
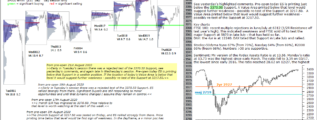
See Monday's pre-open comments, highlighted on chart. Aggressive Buyers marked last three days - that's rare. 3370.50 is First Level Support. Key chartsFTSE 100: recent multiple rejections in June/July at 6312 (1/2R Resistance off last year’s … [Continue reading]
emini 26th August 2020
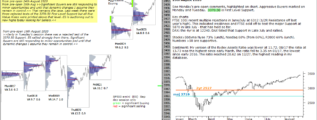
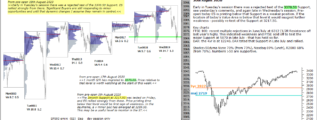
See Monday's pre-open comments, highlighted on chart. Aggressive Buyers marked on Monday and Tuesday. 3370.50 is First Level Support. Key chartsFTSE 100: recent multiple rejections in June/July at 6312 (1/2R Resistance off last year’s high). This … [Continue reading]
emini SP500 25th August 2020
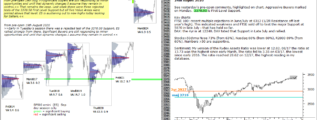
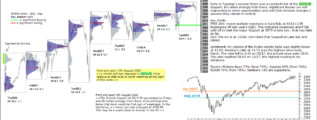
See yesterday's pre-open comments, highlighted on chart. Aggressive Buyers marked on Monday. 3370.50 is First Level Support. Key chartsFTSE 100: recent multiple rejections in June/July at 6312 (1/2R Resistance off last year’s high). This indicated … [Continue reading]
emini SP500 24th August 2020
from pre-open 19th Aug >>Significant Buyers are still responding to minor opportunities and until that dynamic changes I assume they remain in control.<< That remains the case. Last week there were three rejected tests of the 3370.50 … [Continue reading]
ChartProfit Chart Book 21st August 2020
ChartProfit Chart Book - week ending 21st August 2020 … [Continue reading]
SP500 emini 21st August 2020
Pre-open today #ES is printing just below the 3370.50 Support. A Value Area printed below that level would be the first sign of weakness and increase the odds of a re-test of the Support at 3217.50 Key chartsFTSE 100: recent multiple rejections in … [Continue reading]
SP500 emini 20th August 2020
Early in Tuesday's session there was a rejected test of the 3370.50 Support, see yesterday's comments, and again late in Wednesday's session. Pre-open today ES is printing below that Support in a weaker position. If the location of today's Value Area … [Continue reading]
emini SP500 19th August 2020
Early in Tuesday's session there was a rejected test of the 3370.50 Support. ES rallied strongly from there. Significant Buyers are still responding to minor opportunities and until that dynamic changes I assume they remain in control. Key … [Continue reading]
- « Previous Page
- 1
- …
- 124
- 125
- 126
- 127
- 128
- …
- 556
- Next Page »