ChartProfit Chart Book - week ending 16th October 2020 … [Continue reading]
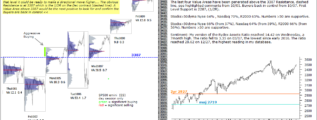
emini ES 16th Oct 2020
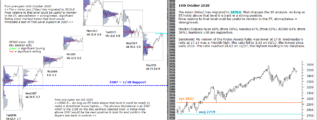
The minor (9day) has migrated to 3479.0. That changes the ST analysis. As long as ES holds above that level it is back in a strong position.Price relative to that level could be useful to monitor in the ST, above/below = … [Continue reading]
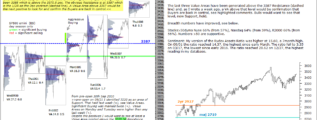
ES emini 15th Oct 2020
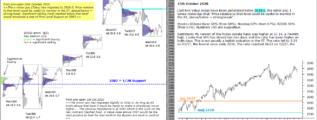
Last two Value Areas have been generated below 3519.0, the minor poc. I wrote yesterday that "Price relative to that level could be useful to monitor in the ST, above/below = strong/weak". Stocks>50dyma Nyse 58% (from 60%), Nasdaq 62% (from … [Continue reading]
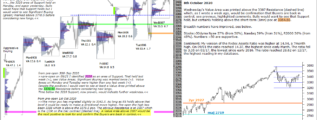
emini ES 14th Oct 2020
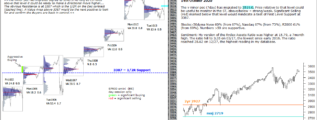
The v minor poc (7day) has migrated to 3519.0. Price relative to that level could be useful to monitor in the ST, above/below = strong/weak. Significant Selling (red) marked below that level would mindicate a test of First Level Support at … [Continue reading]
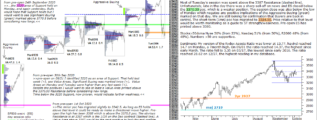
emini SP500 13th Oct 2020
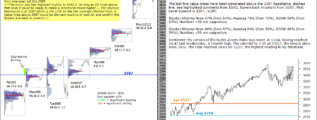
The last five Value Areas have been generated above the 3387 Resistance, dashed line, see highlighted comments from 10/01. Buyers back in control from 10/07. First Level Support is 2287, (1/2R). Stocks>50dyma Nyse 67% (from 64%), Nasdaq 73% … [Continue reading]
emini ES 12th Oct 20
The last four Value Areas have been generated above the 3387 Resistance, dashed line, see highlighted comments from 10/01. Buyers back in control from 10/07. First Level Support is 2287, (1/2R). Stocks>50dyma Nyse 64% , Nasdaq 70%, R2000 65%. … [Continue reading]
ChartProfit Chart Book 9th Oct 2020
ChartProfit Chart Book - week ending 9th October 2020 … [Continue reading]
emini SP500 9th Oct 2020
The last three Value Areas have been generated above the 3387 Resistance (dashed line) and, as I wrote a week ago, a VA above that level would be confirmation that Buyers are back in control, see highlighted comments. Bulls would want to see that … [Continue reading]
emini SP500 8th Oct 2020
Wednesday's Value Area was printed above the 3387 Resistance (dashed line) which, as I wrote a week ago, would be confirmation that Buyers are back in control, see previous, highlighted comments. Bulls would want to see that Support hold, but … [Continue reading]
emini SP500 7th Oct 2020
Most of Tuesday's session was spent above the 3387 Resistance (dashed line). Unfortunately, late in the day there was a sharp sell-off on news and ES closed below the 3370.50 poc, which is a weaker position. The session close was also below the low … [Continue reading]
- « Previous Page
- 1
- …
- 126
- 127
- 128
- 129
- 130
- …
- 562
- Next Page »