• Home

chartprofit.com

Daily analysis - Stock Market, Bonds, Forex and more

emini SP500 18th August 2020

Posted on August 18, 2020 Written by Chart Prophet

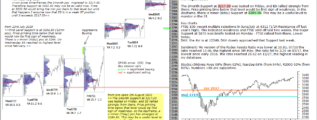
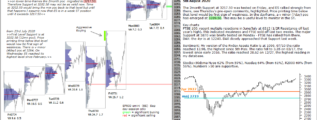
1 month Support/Resistance migrated to 3370.50. Price relative to that level is worth watching. Key chartsFTSE 100: recent multiple rejections in June/July at 6312 (1/2R Resistance off last year’s high). This indicated weakness and FTSE sold off … [Continue reading]

Filed Under: emini SP500 (ES)

emini SP500 17th August 2020

Posted on August 17, 2020 Written by Chart Prophet

1 month S/R has migrated to 3370.50. Price relative to that level is worth watching at the start of this week.S/R = Support/Resistance … [Continue reading]

Filed Under: emini SP500 (ES)

emini SP500 14th August 2020

Posted on August 14, 2020 Written by Chart Prophet

On Tuesday the minor Support migrated to ES 3317.50. Price printing time below this level would be first sign of minor weakness. … [Continue reading]

Filed Under: emini SP500 (ES)

emini SP500 12th August 2020

Posted on August 12, 2020 Written by Chart Prophet

the minor (13 day) Support has migrated to ES 3317.50. Price printing time below this level would be first sign of minor weakness. … [Continue reading]

Filed Under: emini SP500 (ES)

emini SP500 10th August

Posted on August 10, 2020 Written by Chart Prophet

from pre-open 5th August 2020 The 2month Support at 3217.50 was tested 07/30, and ES rallied strongly from there. Price printing time below that level would be first sign of weakness. In the dayframe, a v minor poc has emerged at 3289.50.This may … [Continue reading]

Filed Under: emini SP500 (ES)

SP500 emini 7th August 2020

Posted on August 7, 2020 Written by Chart Prophet

The 2month Support at 3217.50 was tested last week, and ES rallied strongly from there. Price printing time below that level would be first sign of weakness in the longer time-frame. Aggressive Buying was marked again o9n Thursday. In the dayframe, … [Continue reading]

Filed Under: emini SP500 (ES)

EURUSD Chart 6th August

Posted on August 6, 2020 Written by Chart Prophet

… [Continue reading]

Filed Under: emini SP500 (ES)

GBPUSD reaches chart Resistance

Posted on August 6, 2020 Written by Chart Prophet

… [Continue reading]

Filed Under: emini SP500 (ES)

ES emini SP500 6th August

Posted on August 6, 2020 Written by Chart Prophet

The 2month Support at 3217.50 was tested on Friday, and ES rallied strongly from there. Price printing time below that level would be first sign of weakness. In the dayframe, there is minor (8day) Support at 3289.50. This may be a useful level to … [Continue reading]

Filed Under: emini SP500 (ES)

SP500 emini 5th August 2020

Posted on August 5, 2020 Written by Chart Prophet

The 2month Support at 3217.50 was tested on Friday, and ES rallied strongly from there, see Thursday's pre-open comments, highlighted. Price printing time below that level would be first sign of weakness. In the dayframe, a v minor (7day) poc has … [Continue reading]

Filed Under: emini SP500 (ES)

  • « Previous Page
  • 1
  • …
  • 125
  • 126
  • 127
  • 128
  • 129
  • …
  • 556
  • Next Page »

Archives

Copyright © 2026 · Focus Pro Theme on Genesis Framework · WordPress · Log in