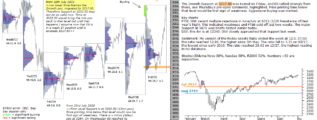
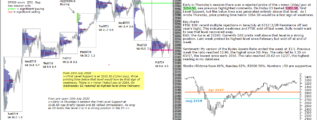
• Home

chartprofit.com

Daily analysis - Stock Market, Bonds, Forex and more

GBPUSD holding major support

Posted on January 26, 2020 Written by Chart Prophet

GBP to USD

GBP to USD 24th January 2020 GBPUSD has held major support at 1.2933 since early December. I wrote on 24th Dec "GBPUSD has rallied strongly from early October and had been printing above the 1.3130 major poc. That poc has now migrated to 1.2933 (now … [Continue reading]

Filed Under: GBPUSD

FTSE 100 big resistance at 7620 still to overcome

Posted on January 26, 2020 Written by Chart Prophet

FTSE 100

FTSE 100 24th January 2020 FTSE 100 has not yet convincingly printed time above 7620, the major Value Area High. Another rejection? Acceptance (time) at, or above, this level would be a bullish indication. … [Continue reading]

Filed Under: FTSE 100

GLD is probing Value Area High again

Posted on January 26, 2020 Written by Chart Prophet

gold price chart

The Gold ETF, GLD is probing Value Area High again GLD is now probing 146.50 again, the major VAH. As I wrote in early October "Acceptance (time) at that level would be bullish". … [Continue reading]

Filed Under: Gold

Treasury Bonds closed strong this week

Posted on January 26, 2020 Written by Chart Prophet

Treasury Bonds

Treasury Bonds 24th January 2020 Treasury Bonds ETF, TLT, closed on Friday above 141.69, the 1/2Range off August high in a stronger position. Bullish if that Support holds in the early part of coming week. click to enlarge chart … [Continue reading]

Filed Under: Treasury Bonds

S&P 500 uptrend intact for now

Posted on January 26, 2020 Written by Chart Prophet

S&P 500

S&P 500 analysis as of close 24th Jan 2020   S&P 500 comment from 30th Oct: SPY has broken to new highs. 307.50 is targeted. Possible rejection if that level is reached but acceptance there (time) would be a further bullish … [Continue reading]

Filed Under: S&P 500

ChartProfit Chart Book w/e 24th January 2020

Posted on January 25, 2020 Written by Chart Prophet

ChartProfit Chart Book - week ending 24th January 2020 … [Continue reading]

Filed Under: Stock Market sentiment

emini 24th January 2020

Posted on January 24, 2020 Written by Chart Prophet

emini

emini 24th January 2020 Aggressive Buying (green) was marked twice last week. First sign of technical weakness would now be a day-session close below 3302.75.0, that is the 01/16 Buying day low (dashed line). Stocks>50dyma numbers: Nyse 63% … [Continue reading]

Filed Under: emini SP500 (ES)

emini ES 23rd January 2020 – pre-open

Posted on January 23, 2020 Written by Chart Prophet

emini

emini ES 23rd January 2020 - pre-open from ChartProfit Aggressive Buying (green) was marked twice last week. First sign of technical weakness would now be a day-session close below 3302.75.0, Thursday's Buying day low (dashed … [Continue reading]

Filed Under: emini SP500 (ES)

emini ES 22nd January 2020 – pre-open

Posted on January 22, 2020 Written by Chart Prophet

futures emini

emini ES 22nd January 2020 - pre-open from ChartProfit Aggressive Buying (green) was marked twice last week. First sign of technical weakness would now be a day-session close below 3302.75.0, Thursday's Buying day low (dashed … [Continue reading]

Filed Under: emini SP500 (ES)

emini ES 21st January 2020 – pre-open

Posted on January 21, 2020 Written by Chart Prophet

emini ES

emini ES 21st January 2020 - pre-open from ChartProfit Aggressive Buying (green) was marked twice last week. First sign of technical weakness would now be a day-session close below 3302.75.0, Thursday's Buying day low (dashed … [Continue reading]

Filed Under: emini SP500 (ES)

  • « Previous Page
  • 1
  • …
  • 126
  • 127
  • 128
  • 129
  • 130
  • …
  • 539
  • Next Page »

Archives

Copyright © 2025 · Focus Pro Theme on Genesis Framework · WordPress · Log in