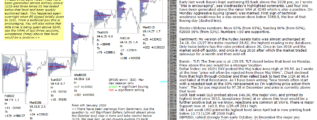
emini ES 21st January 2020 - pre-open from ChartProfit Aggressive Buying (green) was marked twice last week. First sign of technical weakness would now be a day-session close below 3302.75.0, Thursday's Buying day low (dashed … [Continue reading]
Daily analysis - Stock Market, Bonds, Forex and more
emini ES 21st January 2020 - pre-open from ChartProfit Aggressive Buying (green) was marked twice last week. First sign of technical weakness would now be a day-session close below 3302.75.0, Thursday's Buying day low (dashed … [Continue reading]
ChartProfit Chart Book - week ending 17th January 2020 … [Continue reading]
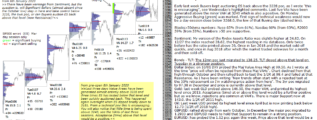
emini ES 17th January 2020 - pre-open from ChartProfit Early last week Buyers kept auctioning ES back above the 3228 poc, as I wrote "this is encouraging", see highlighted comments 8th Jan. On Monday and Thursday Aggressive Buying (green) was … [Continue reading]
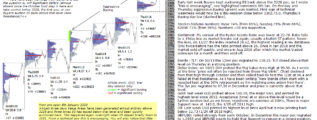
emini ES 15th January 2020 - pre-open from ChartProfit Early last week Buyers kept auctioning ES back above the 3228 poc, as I wrote "this is encouraging", see Wednesday's highlighted comments. Last five VAs have been generated above the minor VAH … [Continue reading]
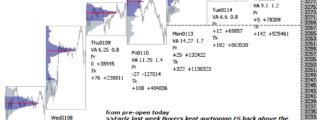
emini future ES 14th January 2020 Early last week Buyers kept auctioning emini futures ES back above the 3228 poc, as I wrote "this is encouraging", see Wednesday's highlighted comments. Last four VAs have been generated above the minor VAH at 3240 … [Continue reading]
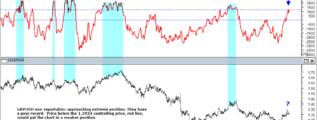
GBPUSD non-reportables approaching extreme position. They have a poor record. Price below the 1.2933 controlling price, red line, would put the chart in a weaker position. … [Continue reading]
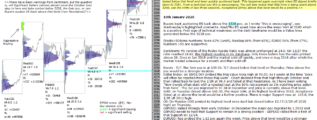
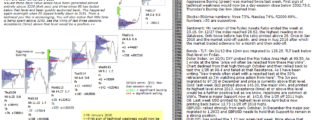
emini SP 500 13th January 2019 - pre-open from ChartProfit Early last week Buyers kept auctioning ES back above the 3228 poc, as I wrote "this is encouraging", see Wednesday's highlighted comments. Wed/-Fri ES spent time above the minor VAH at … [Continue reading]
ChartProfit Chart Book - week ending 10th January 2020 … [Continue reading]

ES emini 10th January 2020 Buyers kept auctioning ES back above the 3228 poc, as I wrote "this is encouraging", see Wednesday's highlighted comments. Wed/Thu ES spent time above the minor VAH at 3240 which is a positive. First sign of technical … [Continue reading]