• Home

chartprofit.com

Daily analysis - Stock Market, Bonds, Forex and more

emini reaches highest level since February

Posted on July 21, 2020 Written by Chart Prophet

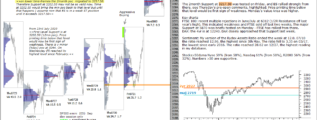
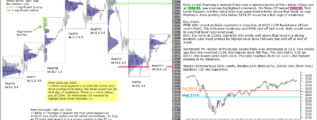
Monday's session generated a higher Value Area and Aggressive Buying was marked. The low on 07/09 was a test of First Level Support at 3106.50. That held, and on smaller timeframe charts, e.g. 5 minue, the First Level Support has now moved up to … [Continue reading]

Filed Under: emini SP500 (ES)

ES emini starts the week in strong position

Posted on July 20, 2020 Written by Chart Prophet

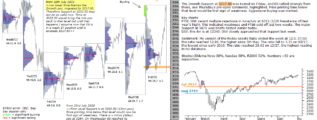
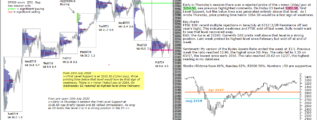
The low on 07/09 was a test of First Level Support at 3106.50. That has held. The first minor sign of weakness would be a day-session close below the low of the 07/10 Buying Day at 3126.50. As long as ES holds 3106.5 it is in a strong position in the … [Continue reading]

Filed Under: emini SP500 (ES)

EURUSD at Resistance

Posted on July 19, 2020 Written by Chart Prophet

EURUSD at Resistance

EURUSD: the 1/2R Resistance (off 2017 low) was again approached this week, see probe in March. Price printing time above this level would put EURUSD in a stronger position with next Resistance at the Value Area High at 1.1681 … [Continue reading]

Filed Under: EURUSD

GBPUSD ST strong position but LT bias is down

Posted on July 19, 2020 Written by Chart Prophet

GBPUSD

… [Continue reading]

Filed Under: GBPUSD

ChartProfit Chart Book 17th July 2020

Posted on July 18, 2020 Written by Chart Prophet

ChartProfit Chart Book - week ending 17th July 2020 … [Continue reading]

Filed Under: Stock Market sentiment

emini 17th July 2020

Posted on July 17, 2020 Written by Chart Prophet

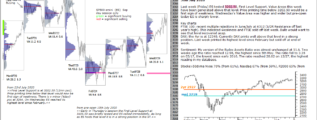
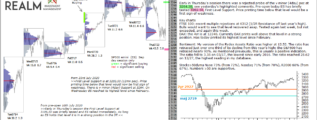
The low last week was a test of First Level Support at 3106.50. That has held. The first minor sign of weakness would be a day-session close below the low of last Friday's Buying Day at 3126.50. As long as ES holds 3106.5 it is in a strong position … [Continue reading]

Filed Under: emini SP500 (ES)

emini 16th July 2020

Posted on July 16, 2020 Written by Chart Prophet

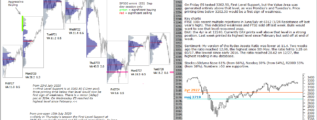
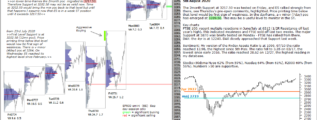
The low last week was a test of First Level Support at 3106.50. That has held. The first minor sign of weakness would be a day-session close below the low of Friday's Buying Day at 3126.50. As long as ES holds 3106.5 it is in a strong position in the … [Continue reading]

Filed Under: emini SP500 (ES)

emini 15th July 2020

Posted on July 15, 2020 Written by Chart Prophet

The low last week was a test of First Level Support at 3106.50 on Thursday. That has held. The first minor sign of weakness would be a day-session close below the low of Friday's Buying Day at 3126.50. As long as ES holds 3106.5 it is in a strong … [Continue reading]

Filed Under: emini SP500 (ES)

emini 14th July 2020

Posted on July 14, 2020 Written by Chart Prophet

The low last week was a test of First Level Support at 3106.50 on Thursday, see chart and previous comments. ES rallied immediately and generated a higher Value Area on Friday with Aggressive Buying (green-at-top) being marked. The first minor sign … [Continue reading]

Filed Under: emini SP500 (ES)

emini report at start of the week

Posted on July 13, 2020 Written by Chart Prophet

The low last week was a test of First Level Support at 3106.50 on Thursday, see chart and previous comments. ES rallied immediately and generated a higher Value Area on Friday with Aggressive Buying (green-at-top) being marked. As long as ES holds … [Continue reading]

Filed Under: emini SP500 (ES)

  • « Previous Page
  • 1
  • …
  • 136
  • 137
  • 138
  • 139
  • 140
  • …
  • 565
  • Next Page »

Archives

Copyright © 2026 · Focus Pro Theme on Genesis Framework · WordPress · Log in