• Home

chartprofit.com

Daily analysis - Stock Market, Bonds, Forex and more

S&P 500 emini 3rd February 2020

Posted on February 3, 2020 Written by Chart Prophet

S&P 500 emini

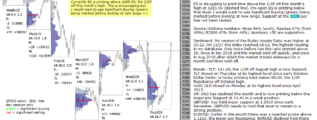
S&P 500 emini 3rd February 2020 S&P 500 emini saw aggressive selling (red-at-bottom) marked on Friday. The Support at the 3228 poc has now been tested, see Wednesday's comments. Pre-open today ES is printing above that level. Price printing … [Continue reading]

Filed Under: emini SP500 (ES)

S&P500 ETF ends in weak position

Posted on February 2, 2020 Written by Chart Prophet

S&P 500

The 4month Support at SPY 323.0 was tested at the end of the week. Bulls would want to see this level recovered quickly. … [Continue reading]

Filed Under: S&P 500

FTSE in weak position

Posted on February 2, 2020 Written by Chart Prophet

FTSE

from 28th Jan: FTSE rejected from 7620, the major VAH and has declined to test the major Support at 7418. Price printing time below that level would be a further negative. … [Continue reading]

Filed Under: FTSE 100

TLT chart update

Posted on February 2, 2020 Written by Chart Prophet

TLT

from 24th Jan 20: TLT closed on Friday above 141.69, the 1/2R off August high in a stronger position. Bullish if that Support holds in early part of coming week. … [Continue reading]

Filed Under: TLT

Dollar Index in weak position at end of week

Posted on February 2, 2020 Written by Chart Prophet

Dollar Index

Dollar Index - Last week there was a rejected probe of the 1/2R Resistance at 98.0. Price declined sharply at the end of the week and the 3yr poc Support at 97.38 was tested. Price below that level would be a weaker position. … [Continue reading]

Filed Under: Dollar Index

GBPUSD update

Posted on February 2, 2020 Written by Chart Prophet

GBPUSD

The major poc has migrated to GBPUSD 1.3128 from 1.2933.  Time printed above 1.3208, the minor 1/2R off Dec high, (dashed line on chart) would put GBPUSD in a strong position. … [Continue reading]

Filed Under: GBPUSD

ChartProfit Chart Book w/e 31st January 2020

Posted on February 1, 2020 Written by Chart Prophet

ChartProfit Chart Book - week ending 31st January 2020 … [Continue reading]

Filed Under: emini SP500 (ES)

S&P 500 emini – pre-open 31st January 2020

Posted on January 31, 2020 Written by Chart Prophet

S&P 500

S&P 500 emini - pre-open 31st January 2020 from ChartProfit The S&P 500 emini (ES) is struggling to print time above the 1/2R off this month's high at 3285.50 (dashed line). Pre-open ES is printing below that level. I would want to see … [Continue reading]

Filed Under: emini SP500 (ES)

S&P 500 emini 30th January 2020

Posted on January 30, 2020 Written by Chart Prophet

S&P 500 emini

S&P 500 emini 30th January 2020 - pre-open from ChartProfit During Thursday's session the 1/2R off this month's high at 3285.50 (dashed line), was tested but quickly rejected. Pre-open ES is printing close to 3250. I would want to see … [Continue reading]

Filed Under: emini SP500 (ES)

ES emini 29th January 2020

Posted on January 29, 2020 Written by Chart Prophet

ES emini

ES emini 29th January 2020 - pre-open from ChartProfit Support at the 3228 poc has not been tested. Currently ES is printing above 3285.50, the 1/2R off this month's high. This is encouraging but I would want to see Significant Buying (green) being … [Continue reading]

Filed Under: emini SP500 (ES)

  • « Previous Page
  • 1
  • …
  • 142
  • 143
  • 144
  • 145
  • 146
  • …
  • 556
  • Next Page »

Archives

Copyright © 2026 · Focus Pro Theme on Genesis Framework · WordPress · Log in