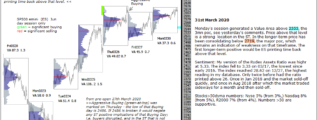
• Home

chartprofit.com

Daily analysis - Stock Market, Bonds, Forex and more

Dollar Index chart updated

Posted on February 22, 2020 Written by Chart Prophet

Dollar Index

Dollar Index - The Major Value Area High at 99.50 was probed again this week, as in September. Looks like rejection, but acceptance (time) at or above this level would be bullish. … [Continue reading]

Filed Under: Dollar Index

GBPUSD chart update

Posted on February 22, 2020 Written by Chart Prophet

GBPUSD

from 10th Feb: The major poc has just migrated lower, back to 1.2933 (from 1.3128). Price below that level would be a weak position. GBPUSD currently prints very close to that Support. … [Continue reading]

Filed Under: GBPUSD

ChartProfit Chart Book w/e 21st February 2020

Posted on February 22, 2020 Written by Chart Prophet

ChartProfit Chart Book - week ending 21st January 2020 … [Continue reading]

Filed Under: Stock Market sentiment

S&P 500 emini 21st February 2020

Posted on February 21, 2020 Written by Chart Prophet

S&P 500 emini

S&P 500 emini 21st February 2020 Dayframe: 14dy poc migrated to 3371 last week. ES is curently finding that level "attractive", possibly a poc of a more important degree is developing here. Aggressive Buying (green-at-top) was marked early … [Continue reading]

Filed Under: emini SP500 (ES)

S&P 500 emini 19th February 2020

Posted on February 19, 2020 Written by Chart Prophet

emini S&P

S&P 500 emini 19th February 2020 - pre-open Dayframe: 14dy poc has migrated to 3371 on Friday. Price to that level is worth monitoring. Aggressive Buying (green-at-top) was marked early last week. The first sign of minor weakness would be a … [Continue reading]

Filed Under: emini SP500 (ES)

emini S&P 500 18th February 2020 – pre-open

Posted on February 18, 2020 Written by Chart Prophet

S&P 500 emini

emini S&P 500 18th February 2020 - pre-open Dayframe: 14dy poc has migrated to 3371. Price to that level is worth monitoring today. Aggressive Buying (green-at-top) was marked early last week. The first sign of minor weakness would be a … [Continue reading]

Filed Under: emini SP500 (ES)

ChartProfit Chart Book – w/e 14th February 2020

Posted on February 16, 2020 Written by Chart Prophet

ChartProfit Chart Book - week ending 14th January 2020 … [Continue reading]

Filed Under: Stock Market sentiment

emini S&P 500 14th February 2020 – pre-open

Posted on February 14, 2020 Written by Chart Prophet

S&P emini

emini S&P 500 14th February 2020 - pre-open from ChartProfit Comment unchanged. Aggressive Buying (green-at-top) was marked on Monday. The first sign of minor weakness would now be a day-session close below 3323 (dashed line), the low of that … [Continue reading]

Filed Under: emini SP500 (ES)

S&P 500 emini 13th February 2020 – pre-open

Posted on February 13, 2020 Written by Chart Prophet

S&P 500 emini

S&P 500 emini 13th February 2020 - pre-open from ChartProfit Comment unchanged from yesterday. Aggressive Buying (green-at-top) was marked on Monday. The first sign of minor weakness would now be a day-session close below 3323 (dashed line), the … [Continue reading]

Filed Under: emini SP500 (ES)

emini S&P 500 12th February 2020 – pre-open

Posted on February 12, 2020 Written by Chart Prophet

S&P 500 emini

emini S&P 500 12th February 2020 - pre-open from ChartProfit Aggressive Buying (green-at-top) was marked on Monday. The first sign of minor weakness would now be a day-session close below 3323(dashed line), the low of that Buying day. The minor … [Continue reading]

Filed Under: emini SP500 (ES)

  • « Previous Page
  • 1
  • …
  • 143
  • 144
  • 145
  • 146
  • 147
  • …
  • 559
  • Next Page »

Archives

Copyright © 2026 · Focus Pro Theme on Genesis Framework · WordPress · Log in