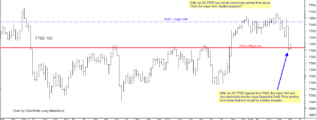
FTSE was rejected from 7620, the major VAH and has declined to test the major Support at 7418. Price printing time below that level would be a further negative. … [Continue reading]
Daily analysis - Stock Market, Bonds, Forex and more
FTSE was rejected from 7620, the major VAH and has declined to test the major Support at 7418. Price printing time below that level would be a further negative. … [Continue reading]
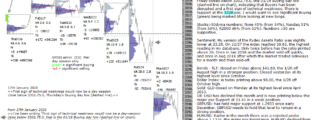
S&P 500 emini 28th January 2020 - pre-open from ChartProfit S&P 500 emini closed on Friday below 3302.75.0, the 01/16 Buying day low (dashed line on chart), indicating that Buyers had been disrupted and a first sign of technical weakness. … [Continue reading]
S&P 500 futures emini 27th January 2020 I've been writing "First sign of technical weakness would now be a day-session close below 3302.75, that is the 01/16 Buying day low (dashed line on chart). That's what we got on Friday. The 1month poc at … [Continue reading]
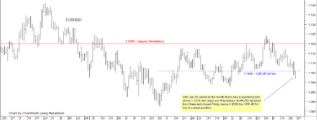
EUR to USD ended the week below Support. Earlier in the month there was a rejected probe above 1.1216, the major poc Resistance. EURUSD declined from there and ended the week below 1.1058, the 1/2Range off October low, in a weak position. … [Continue reading]
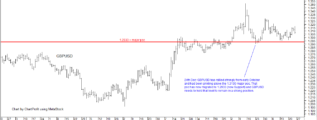
GBP to USD 24th January 2020 GBPUSD has held major support at 1.2933 since early December. I wrote on 24th Dec "GBPUSD has rallied strongly from early October and had been printing above the 1.3130 major poc. That poc has now migrated to 1.2933 (now … [Continue reading]
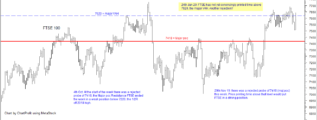
FTSE 100 24th January 2020 FTSE 100 has not yet convincingly printed time above 7620, the major Value Area High. Another rejection? Acceptance (time) at, or above, this level would be a bullish indication. … [Continue reading]
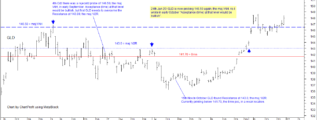
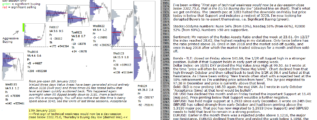
The Gold ETF, GLD is probing Value Area High again GLD is now probing 146.50 again, the major VAH. As I wrote in early October "Acceptance (time) at that level would be bullish". … [Continue reading]
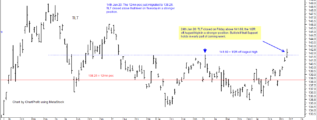
Treasury Bonds 24th January 2020 Treasury Bonds ETF, TLT, closed on Friday above 141.69, the 1/2Range off August high in a stronger position. Bullish if that Support holds in the early part of coming week. click to enlarge chart … [Continue reading]
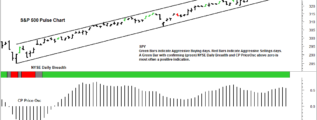
S&P 500 analysis as of close 24th Jan 2020 S&P 500 comment from 30th Oct: SPY has broken to new highs. 307.50 is targeted. Possible rejection if that level is reached but acceptance there (time) would be a further bullish … [Continue reading]
ChartProfit Chart Book - week ending 24th January 2020 … [Continue reading]