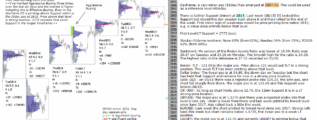
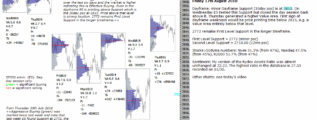
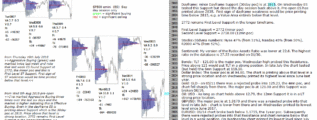
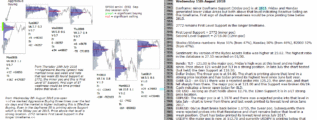
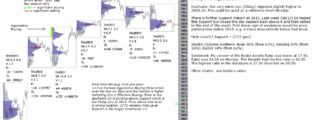
• Home

chartprofit.com

Daily analysis - Stock Market, Bonds, Forex and more

Stockmarket sentiment – charts through 3rd August 2018

Posted on August 5, 2018 Written by Chart Prophet

Stockmarket Sentiment - Charts through 3rd August 2018 - Chartprofit eBook Stock Market Sentiment. Consensus polls, mutual fund flow indicators, Commitment of traders charts. Key Support and Resistance levels for major Stock Index ETFs, Bonds, Gold, … [Continue reading]

Filed Under: Stock Market sentiment

Stockmarket review 3rd August 2018

Posted on August 3, 2018 Written by Chart Prophet

Stockmarket review 3rd August 2018 … [Continue reading]

Filed Under: Stock Market sentiment

emini 3rd August 2018 – pre-open

Posted on August 3, 2018 Written by Chart Prophet

emini futures 3rd august 2018

emini 3rd August 2018 - pre-open from Chartprofit See Wednesday's highlighted comments. Dayframe: The v min (25day) poc remains at 2815 and price relative to that level worth monitoring re strength/weakness. 2772 remains First Level Support. … [Continue reading]

Filed Under: emini SP500 (ES)

emini analysis 2nd August 2018

Posted on August 2, 2018 Written by Chart Prophet

emini futures 2nd august 2018

emini analysis 2nd August 2018 from Chartprofit Tuesday's green-at-top high was briefly broken but then ES sold off and generated a lower Value Area, i.e. once again no follow-on buying, see Wednesday's comments. The v min (25day) poc remains at … [Continue reading]

Filed Under: emini SP500 (ES)

ES analysis Wednesday 1st August 2018

Posted on August 1, 2018 Written by Chart Prophet

emini futures 1st august 2018

ES analysis Wednesday 1st August 2018 from Chartprofit Green-at-top highs and Red-at-bottom lows indicate continuation in the short term. Unusually, the Buying imbalance last Wednesday and the Selling imbalance on Monday did not see follow-on in … [Continue reading]

Filed Under: emini SP500 (ES)

ES analysis Tuesday 31st July 2018

Posted on July 31, 2018 Written by Chart Prophet

emini futures 31st july 2018

ES analysis Tuesday 31st July 2018 from Chartprofit Aggressive Selling (red) was marked on Friday and again on Monday. Red-at-bottom lows are usually tested within a day (or two). New long trades are eliminated for me, at least until Significant … [Continue reading]

Filed Under: emini SP500 (ES)

ES analysis – Monday 30th July 2018

Posted on July 30, 2018 Written by Chart Prophet

emini futures 30th july 2018

ES analysis - Monday 30th July 2018 from Chartprofit On Wednesday, Aggressive Buying (green) was marked. Unusually that green-at-top high was not exceeded within the next two trading days and in fact Wednesday's low was broken on Friday negating … [Continue reading]

Filed Under: emini SP500 (ES)

Stockmarket review 20th July 2018

Posted on July 20, 2018 Written by Chart Prophet

Stockmarket review 20th July 2018 … [Continue reading]

Filed Under: Stock Market sentiment

emini 20th July 2018 – pre-open

Posted on July 20, 2018 Written by Chart Prophet

emini futures 20th july 2018

emini 20th July 2018 - pre-open from Chartprofit I can add very little to yesterday's comments. Aggressive Buying (green) was marked twice last week and note that last week ES found Support at 2772, the minor poc (see chart) - this is First Level ST … [Continue reading]

Filed Under: emini SP500 (ES)

emini 19th July 2018 – pre-open

Posted on July 19, 2018 Written by Chart Prophet

emini futures 19th july 2018

emini 19th July 2018 - pre-open from Chartprofit Aggressive Buying (green) was marked twice last week and note that last week ES found Support at 2772, the minor poc (see chart) and this is First Level ST Support. First sign of ST weakness would be … [Continue reading]

Filed Under: emini SP500 (ES), Market pre-open Report

  • « Previous Page
  • 1
  • …
  • 208
  • 209
  • 210
  • 211
  • 212
  • …
  • 561
  • Next Page »

Archives

Copyright © 2026 · Focus Pro Theme on Genesis Framework · WordPress · Log in