• Home

chartprofit.com

Daily analysis - Stock Market, Bonds, Forex and more

a minor sign of weakness on the SP500 Pulse Chart

Posted on January 31, 2018 Written by Chart Prophet

sp-500-pulse-chart-30th-January-2018

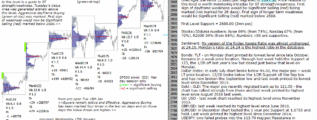
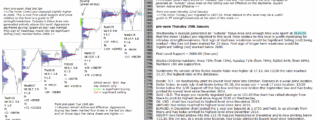
In early September Momentum (PriceOsc) turned positive (arrow). Since that point there has been seventeen days when Aggressive Buying (green) has been marked. There wasn't a subsequent close below the lows of those Green Bars until yesterday. That … [Continue reading]

Filed Under: Market Timing

emini futures 30th January 2018 – pre-open

Posted on January 30, 2018 Written by Chart Prophet

emini futures 30th jan 2018

emini futures 30th January 2018 - pre-open from Chartprofit Overnight the minor (25day) poc migrated to 2841.50. Price relative to this level is worth monitoring intraday for ST strength/weakness. First sign of dayframe weakness would be Significant … [Continue reading]

Filed Under: emini SP500 (ES), Market pre-open Report

emini futures 29th January 2018 – pre-open

Posted on January 29, 2018 Written by Chart Prophet

emini futures 29th jan 2018

emini futures 29th January 2018 - pre-open from Chartprofit Friday's session generated a higher, wider, Value Area and Aggressive Buying was marked again. First sign of dayframe weakness would be Significant Selling (red) being marked - this has not … [Continue reading]

Filed Under: emini SP500 (ES), Market pre-open Report

Stockmarket sentiment – charts through 26th January 2018

Posted on January 28, 2018 Written by Chart Prophet

Stock Market Sentiment - Charts through 26th January 2018 - Chartprofit eBook Stock Market Sentiment. Consensus polls, mutual fund flow indicators, Commitment of traders charts. Key Support and Resistance levels for major Stock Index ETFs, Bonds, … [Continue reading]

Filed Under: Stock Market sentiment

a very strong trend since September

Posted on January 27, 2018 Written by Chart Prophet

a very strong trend since September

A very strong trend since September. Since momentum turned positive back in early September there has not been a single day where a close was below a previous Green Bar Low, see chart. In fact the vast majority were not even tested. This is … [Continue reading]

Filed Under: Market Timing

Stockmarket review 26th January 2018

Posted on January 26, 2018 Written by Chart Prophet

Stock market review - 26th January 2018 … [Continue reading]

Filed Under: Stock Market sentiment

emini analysis 25th January 2018 – post-close

Posted on January 25, 2018 Written by Chart Prophet

emini futures post close 25th jan 2017

emini analysis 25th January 2018 - post-close Thursday's session generated an "inside" Value Area. 2839.00 attracted more time - Price relative to this minor (19day) poc is worth monitoring for ST strength/weakness. First sign of dayframe weakness … [Continue reading]

Filed Under: emini SP500 (ES), Market pre-open Report

emini futures 25th January 2018 – pre-open

Posted on January 25, 2018 Written by Chart Prophet

emini futures 25th jan 2017

emini futures 25th January 2018 - pre-open from Chartprofit Wednesday's session generated an "outside" Value Area and enough time was spent at 2839.00 that the minor (18day) poc migrated to this level. Price relative to this level is worth … [Continue reading]

Filed Under: emini SP500 (ES), Market pre-open Report

emini futures analysis 24th January 2018 – pre-open

Posted on January 24, 2018 Written by Chart Prophet

emini futures 24th jan 2017

emini futures analysis 24th January 2018 - pre-open from Chartprofit Tuesday's session generated another Value Area was above 2807.50, the minor poc, see Monday's, highlighted, comments. First sign of dayframe weakness would be Significant Selling … [Continue reading]

Filed Under: emini SP500 (ES), Market pre-open Report

emini futures 23rd January 2018

Posted on January 23, 2018 Written by Chart Prophet

emini futures 23rd jan 2017

emini futures 23rd January 2018 - from Chartprofit Monday's Value Area was printed entirely above 2807.50, the minor poc, see yesterday's, highlighted, comments. Aggressive Buying ()green-at-top) was marked for the fourth time in seven days. First … [Continue reading]

Filed Under: emini SP500 (ES), Market pre-open Report

  • « Previous Page
  • 1
  • …
  • 227
  • 228
  • 229
  • 230
  • 231
  • …
  • 562
  • Next Page »

Archives

Copyright © 2026 · Focus Pro Theme on Genesis Framework · WordPress · Log in