• Home

chartprofit.com

Daily analysis - Stock Market, Bonds, Forex and more

Technical analysis – Market pre-open 18th May 2016

Posted on May 18, 2016 Written by Chart Prophet

Technical analysis - Market pre-open 18th May 2016

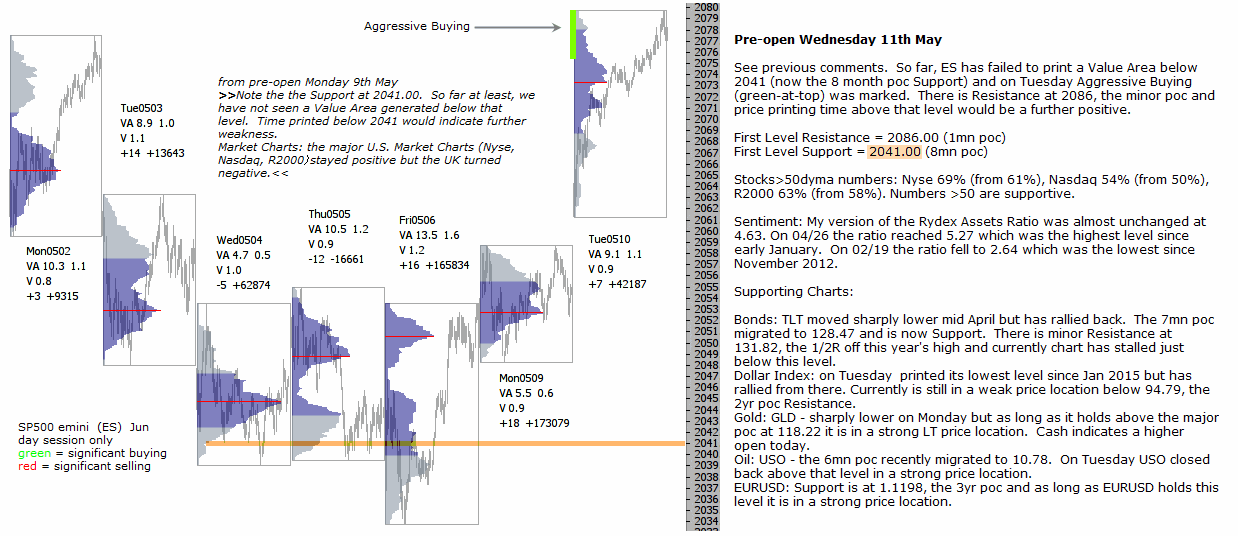
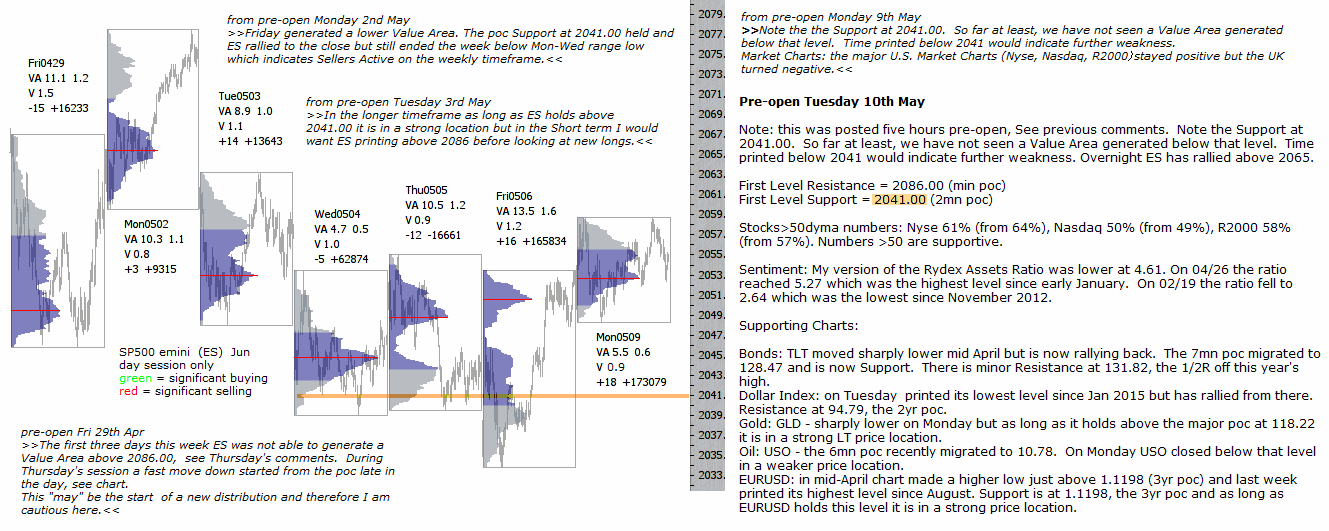
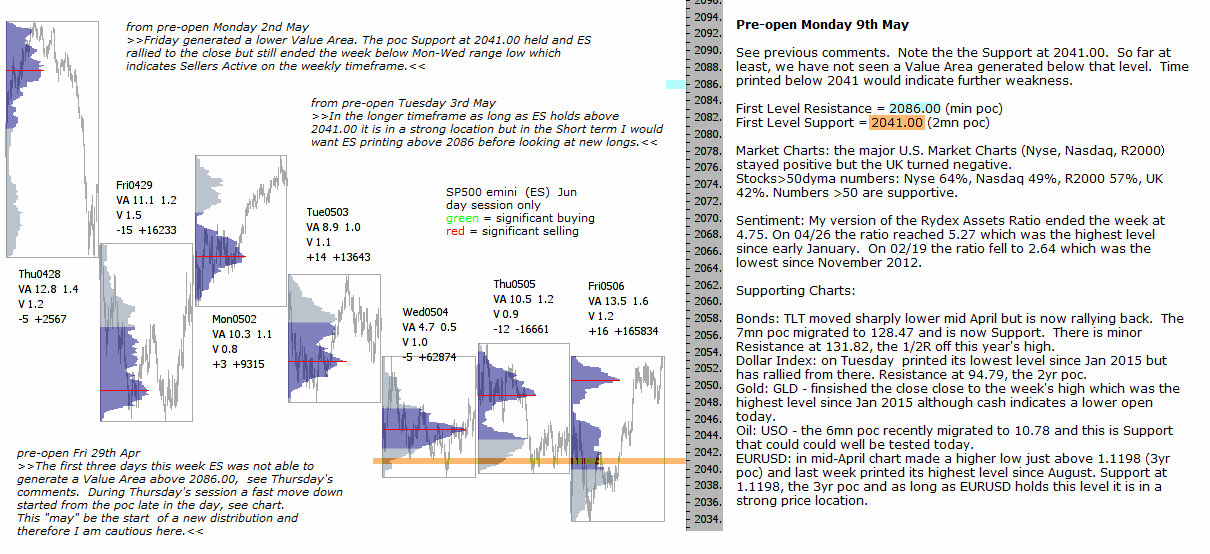
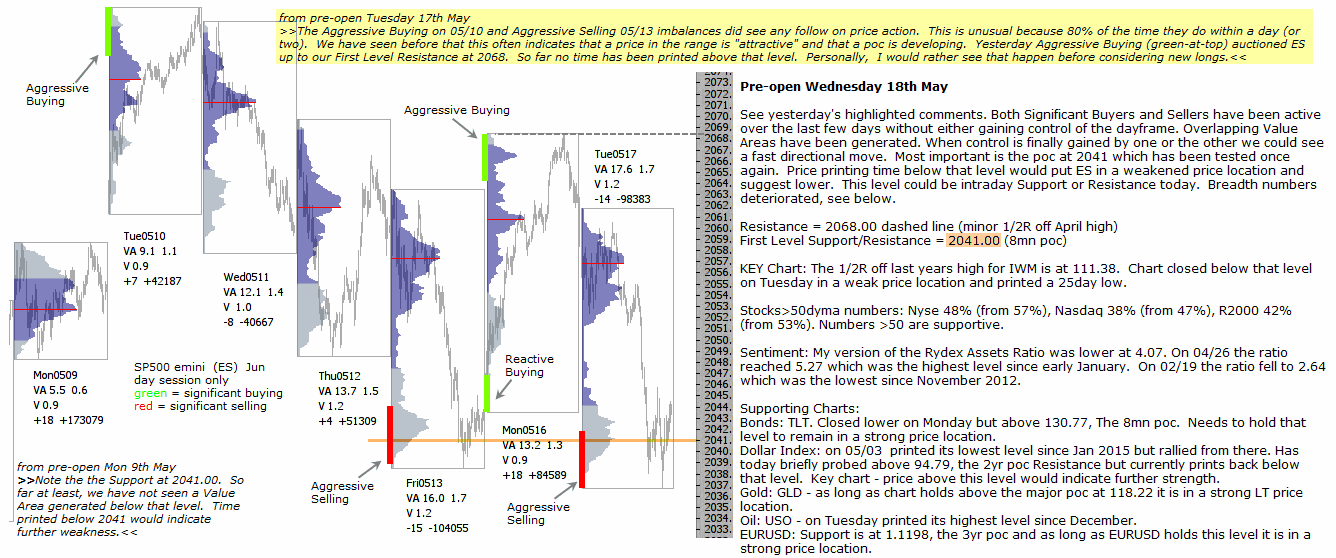
Technical analysis - Market pre-open 18th May 2016 See yesterday's highlighted comments. Both Significant Buyers and Sellers have been active over the last few days without either gaining control of the dayframe. Overlapping Value Areas have been … [Continue reading]

Filed Under: emini SP500 (ES), Market pre-open Report

Technical analysis – Market pre-open 17th May 2016

Posted on May 17, 2016 Written by Chart Prophet

Technical analysis - Market pre-open 17th May 2016

Technical analysis - Market pre-open 17th May 2016 See previous comments. The Aggressive Buying on 05/10 and Aggressive Selling 05/13 imbalances did see any follow on price action. This is unusual because 80% of the time they do within a day (or … [Continue reading]

Filed Under: emini SP500 (ES), Market pre-open Report

Technical analysis – Market pre-open 16th May 2016

Posted on May 16, 2016 Written by Chart Prophet

Technical analysis - Market pre-open Monday 16th May

Pre-open Monday 16th May ES finished the week near the low and during Friday's session again tested the 2041 poc Support. Aggressive Selling (red-at-bottom) was marked but in the longer timeframe this Selling can be called Reactive because it has … [Continue reading]

Filed Under: emini SP500 (ES), Market pre-open Report

Market Sentiment Chart Book – 13th May 2016

Posted on May 16, 2016 Written by Chart Prophet

Market Sentiment Chart Book 13th May 2016 - eBook Market Sentiment Chart Book 13th May 2016 - pdf … [Continue reading]

Filed Under: eBook

Stock Market Review – Chartprofit Video 13th April 2016

Posted on May 13, 2016 Written by Chart Prophet

Chartprofit video is available to view Or watch on Youtube … [Continue reading]

Filed Under: video

Technical analysis – Market pre-open 13th May 2016

Posted on May 13, 2016 Written by Chart Prophet

Technical analysis - Market pre-open 13th May 2016

Technical analysis - Market pre-open 13th May 2016 ES opened on Thursday close to 2068 (dashed), the minor 1/2R off the April high and immediately sold off, see yesterday's highlighted comments. Overnight ES has printed as low as 2046.25 with the … [Continue reading]

Filed Under: emini SP500 (ES), Market pre-open Report

Technical analysis – Market pre-open 12th May 2016

Posted on May 12, 2016 Written by Chart Prophet

Technical analysis - Market pre-open 12th May 2016

Technical analysis - Market pre-open 12th May 2016 See previous comments. On Tuesday I marked Aggressive Buying. However on Wednesday ES printed below Tuesday's low negating any ST positive implications of that green-at-top high. As of ninety … [Continue reading]

Filed Under: emini SP500 (ES), Market pre-open Report

Technical analysis – Market pre-open 11th May 2016

Posted on May 11, 2016 Written by Chart Prophet

Technical analysis - Market pre-open 11th May 2016

Technical analysis - Market pre-open 11th May 2016 See previous comments. So far, ES has failed to print a Value Area below 2041 (now the 8 month poc Support) and on Tuesday Aggressive Buying (green-at-top) was marked. There is Resistance at 2086, … [Continue reading]

Filed Under: emini SP500 (ES), Market pre-open Report

Technical analysis – Market pre-open 10th May 2016

Posted on May 10, 2016 Written by Chart Prophet

Technical analysis - Market pre-open 10th May 2016

Technical analysis - Market pre-open 10th May 2016 Note: this was posted five hours pre-open, See previous comments. Note the Support at 2041.00. So far at least, we have not seen a Value Area generated below that level. Time printed below 2041 … [Continue reading]

Filed Under: emini SP500 (ES), Market pre-open Report

Technical analysis – Market pre-open 9th May 2016

Posted on May 9, 2016 Written by Chart Prophet

Technical analysis - Market pre-open 9th May 2016

Technical analysis - Market pre-open 9th May 2016 See previous comments. There is Support at 2041.00. So far at least, we have not seen a Value Area generated below that level. Time printed below 2041 would indicate further weakness. First … [Continue reading]

Filed Under: emini SP500 (ES), Market pre-open Report

  • « Previous Page
  • 1
  • …
  • 286
  • 287
  • 288
  • 289
  • 290
  • …
  • 562
  • Next Page »

Archives

Copyright © 2026 · Focus Pro Theme on Genesis Framework · WordPress · Log in