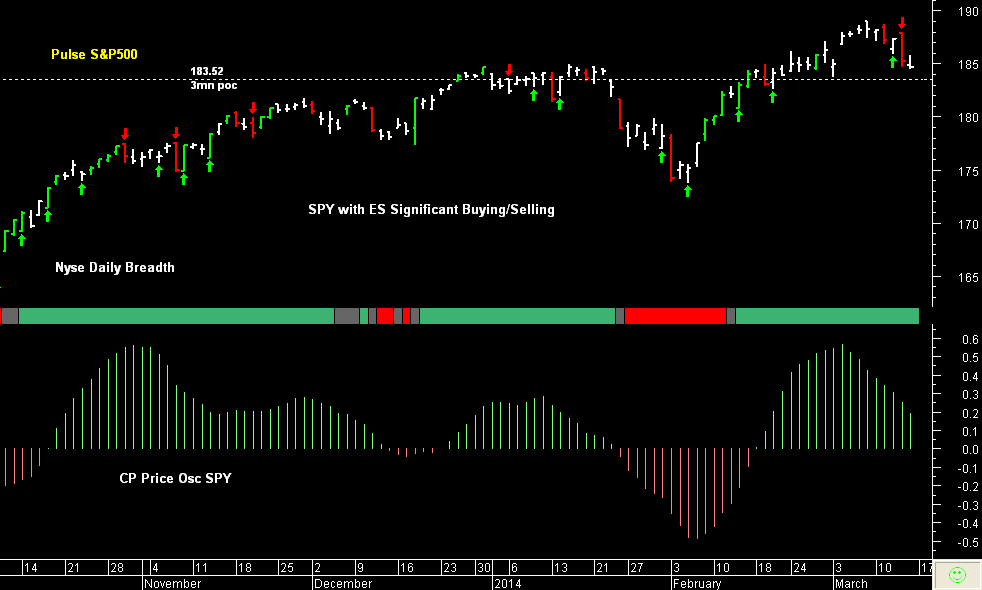
S&P 500 emini pre-open Monday 17th March
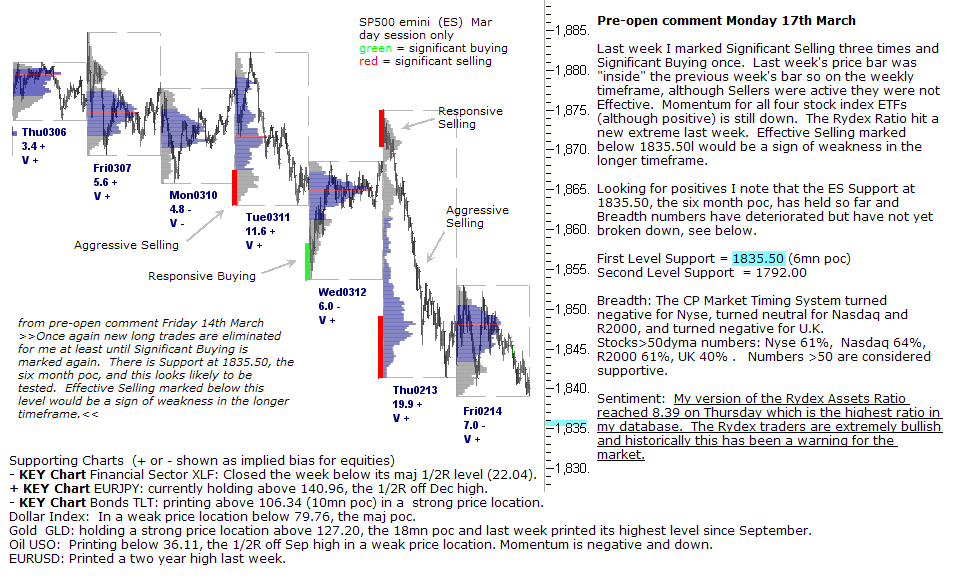
posted 09.15 a.m. est Pre-open comment Monday 17th March Last week I marked Significant Selling three times and Significant Buying once. Last week's price bar was "inside" the previous week's bar so on the weekly timeframe, although Sellers … [Continue reading]
ChartProfit Webcast 14th March
Today's ChartProfit Webcast is available to view … [Continue reading]
SPY pre-open Friday 14th March
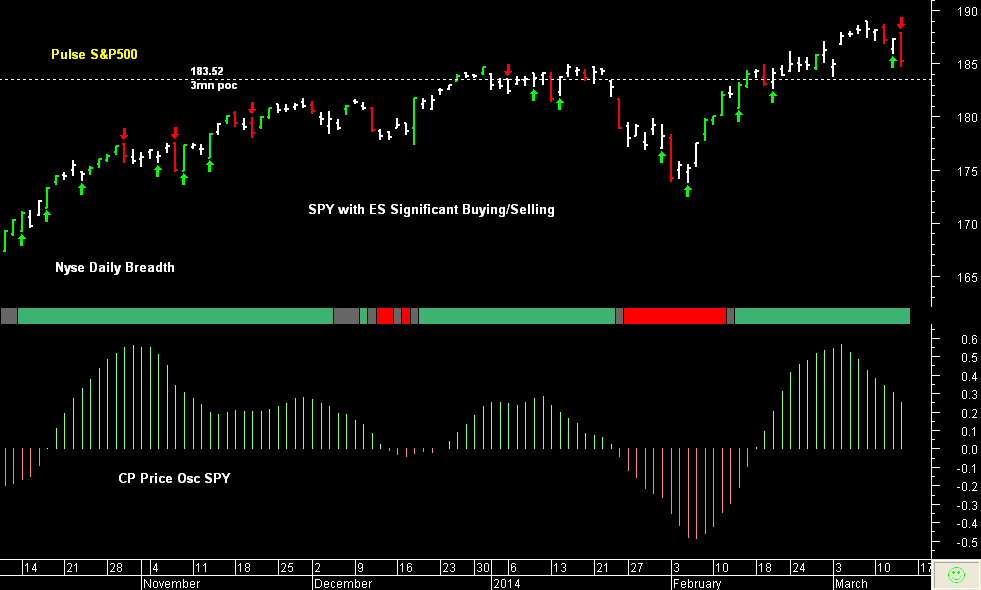
S&P 500 emini pre-open Friday 14th March
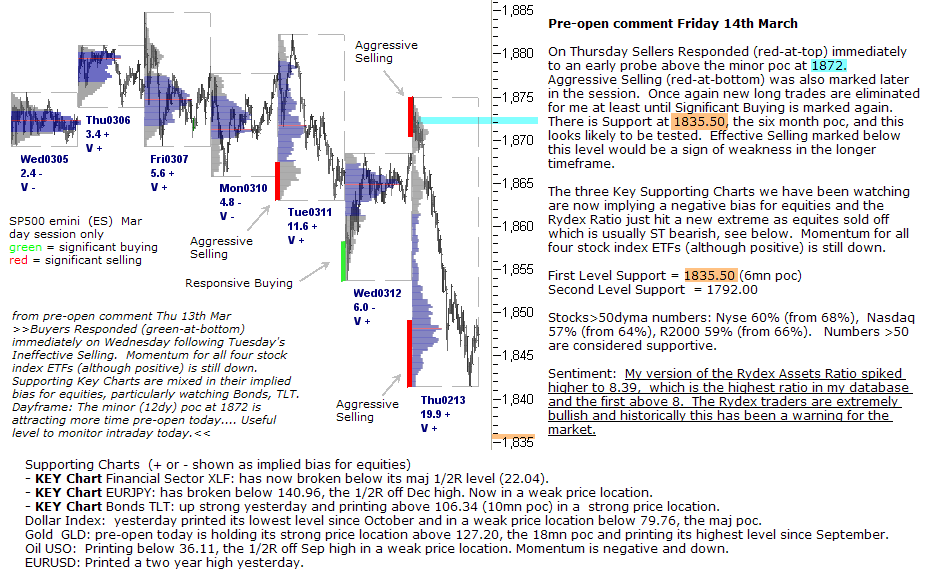
posted 09.05 a.m. est Pre-open comment Friday 14th March On Thursday Sellers Responded (red-at-top) immediately to an early probe above the minor poc at 1872. Aggressive Selling (red-at-bottom) was also marked later in the session. Once again … [Continue reading]
SPY pre-open Thursday 13th March
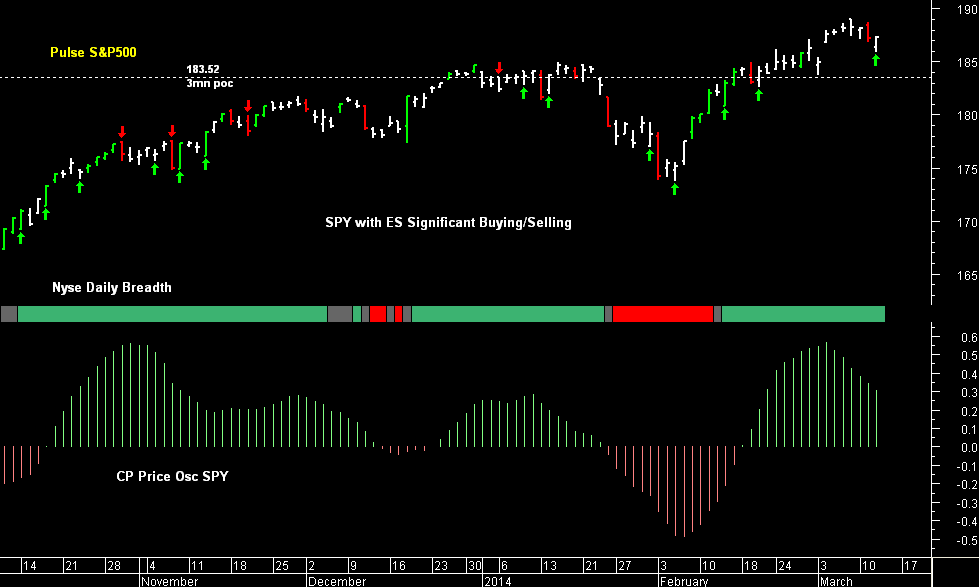
S&P 500 emini pre-open Thursday 13th March
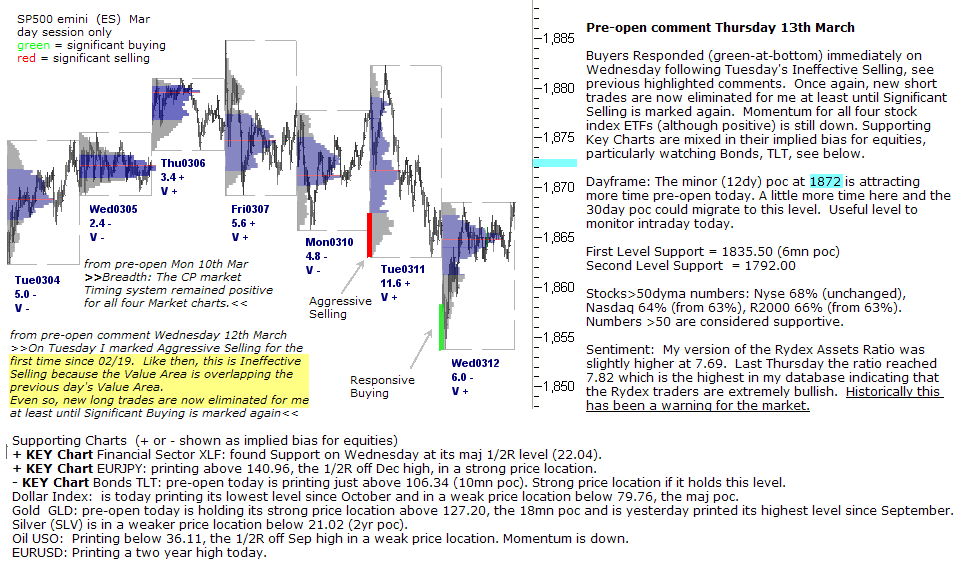
posted 08.59 a.m. est Pre-open comment Thursday 13th March Buyers Responded (green-at-bottom) immediately on Wednesday following Tuesday's Ineffective Selling, see previous highlighted comments. Once again, new short trades are now eliminated … [Continue reading]
SPY pre-open Wednesday 12th March
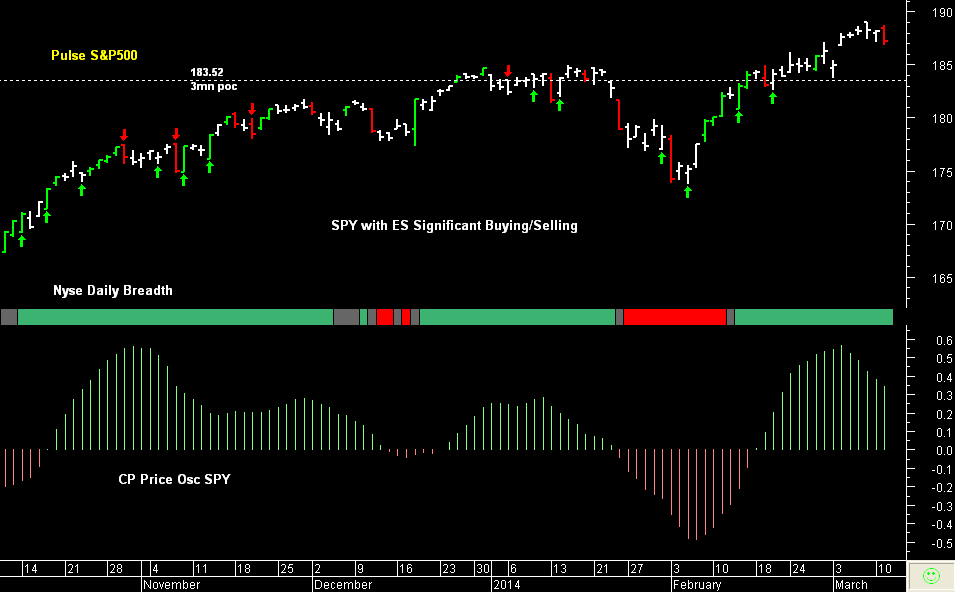
S&P 500 emini pre-open Wednesday 12th March
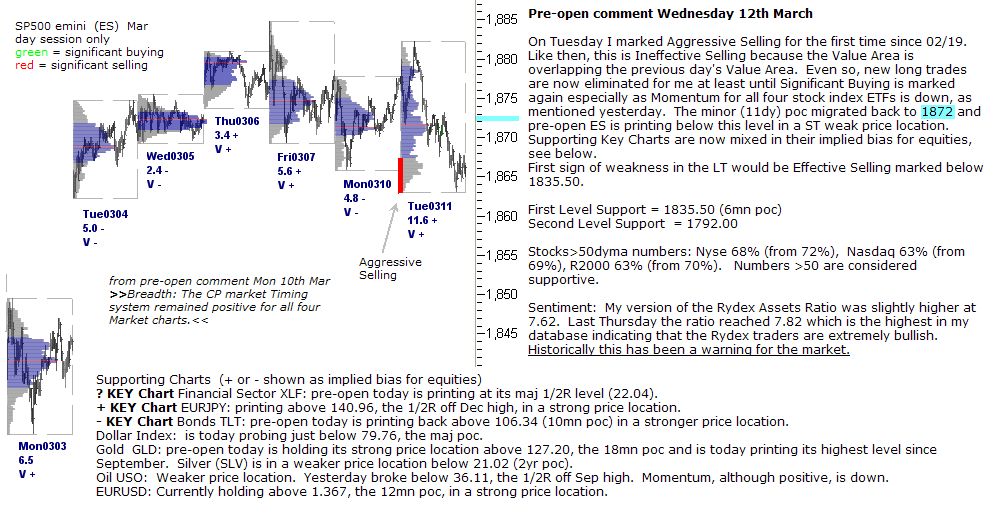
posted 09.12 a.m. est Pre-open comment Wednesday 12th March On Tuesday I marked Aggressive Selling for the first time since 02/19. Like then, this is Ineffective Selling because the Value Area is overlapping the previous day's Value Area. Even … [Continue reading]
Should Investors worry about this chart?
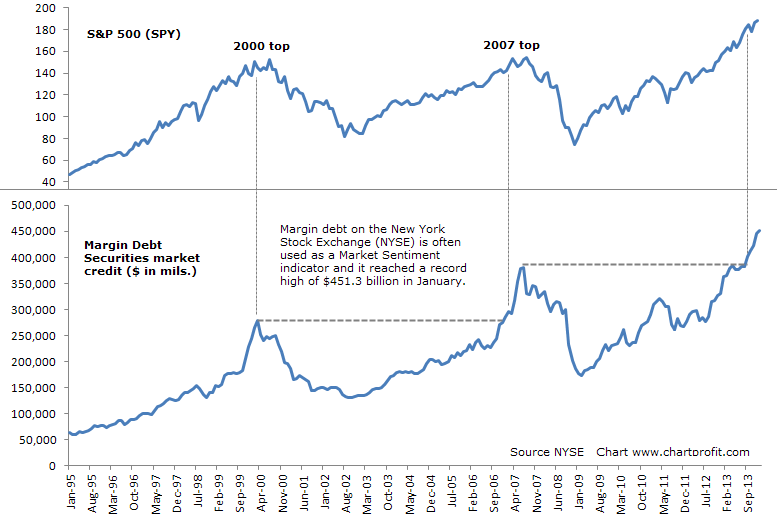
Margin debt on the New York Stock Exchange (NYSE) is often used as a Market Sentiment indicator and it reached a record high of $451.3 billion in January. What is Margin … [Continue reading]
- « Previous Page
- 1
- …
- 398
- 399
- 400
- 401
- 402
- …
- 567
- Next Page »