• Home

chartprofit.com

Daily analysis - Stock Market, Bonds, Forex and more

ES_F e-mini 7th December 2023

Posted on December 7, 2023 Written by Chart Prophet

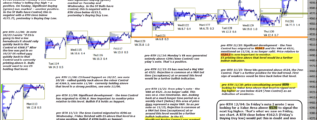
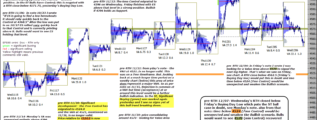
Wednesday's RTH closed below Friday's Buying Day Low which puts the ST bull case in doubt, see Monday's note. also from that note: time below 4524 (7mn Control) would be unexpected and weaken the Bullish scenario. Bulls would want to see 4570 … [Continue reading]

Filed Under: emini SP500 (ES)

ES_F e-mini 6th December 2023

Posted on December 6, 2023 Written by Chart Prophet

Technically, last week finished positively and although there has been a slight retracement at the start of this week with ES continuing to "like" 4570 (see previous notes) there has been no clear sign of weakness. … [Continue reading]

Filed Under: emini SP500 (ES)

ES_F e-mini 4th December 2023

Posted on December 4, 2023 Written by Chart Prophet

In Friday's note I wrote I was looking for a Value Area above 4570 to signal the next leg higher. That's what we saw on Friday, see chart. A RTH close below 4562.5 (Friday's Buying Day low) would put this in doubt and imo time below 4524 (7mn … [Continue reading]

Filed Under: emini SP500 (ES)

ES_F e-mini 30th November 2023

Posted on November 30, 2023 Written by Chart Prophet

price is consolidating around 4570 - I'm looking for a Value Area above that level to signal next leg higher or one below 4524 (7mn Control) as an indication of weakness. … [Continue reading]

Filed Under: emini SP500 (ES)

ES_F e-mini 29th November 2023

Posted on November 29, 2023 Written by Chart Prophet

Today, price has convincingly exceeded 4570. As mentioned previously, first sign of weakness would be time back below 4524, the 7mn Control. … [Continue reading]

Filed Under: emini SP500 (ES)

ES_F e-mini 28th November 2023

Posted on November 28, 2023 Written by Chart Prophet

From yesterday's note: Today, price relative to 4570.0 is worth monitoring as minor Support/Resistance. 4570.0 was the exact high yesterday. There is Support around 4524, the 7mn Control. First sign of weakness would be time back below that … [Continue reading]

Filed Under: emini SP500 (ES)

ES_F e-mini 27th November 2023

Posted on November 27, 2023 Written by Chart Prophet

ES held above 4524, the 7mn Control, last week which is a further positive for the bull trend. First sign of weakness in the longer timeframe would be time back below that level. Today, price relative to 4570.0 is worth monitoring as minor … [Continue reading]

Filed Under: emini SP500 (ES)

ES_F e-mini 23rd November 2023

Posted on November 23, 2023 Written by Chart Prophet

Three VAs generated above 4524, the 7mn Control. That's a further positive for the bull trend. First sign of weakness would be time back below that level. Today, price relative to 4570.0 is worth monitoring as minor Support/Resistance. … [Continue reading]

Filed Under: emini SP500 (ES)

ES_F e-mini 22nd November 2023

Posted on November 22, 2023 Written by Chart Prophet

Two Value Areas generated above 4524, the 7mn Control. That's a further positive for the bull trend. First sign of weakness would be time back below that level. … [Continue reading]

Filed Under: emini SP500 (ES)

ES_F e-mini 21st November 2023

Posted on November 21, 2023 Written by Chart Prophet

from yesterday's note: the VAH at 4521..is no longer valid. This was on a 7mn timeframe. But.. looking back at a much longer time period on a weekly chart this area of price does represent a major VAH. So as per note on 11/15, Rejection is common … [Continue reading]

Filed Under: emini SP500 (ES)

  • « Previous Page
  • 1
  • …
  • 51
  • 52
  • 53
  • 54
  • 55
  • …
  • 562
  • Next Page »

Archives

Copyright © 2026 · Focus Pro Theme on Genesis Framework · WordPress · Log in