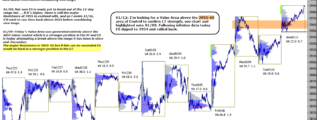
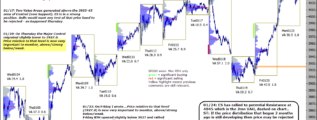
• Home

chartprofit.com

Daily analysis - Stock Market, Bonds, Forex and more

S&P 500 e-mini 7th April 2022

Posted on April 7, 2022 Written by Chart Prophet

ES declined to briefly test the First Level Support at 4447.0 (1/2R off this year's high) given in yesterday's note. Bulls would want this level to hold and certainly the lower, and more important Support at the 4353 Major Control. ST: 5week … [Continue reading]

Filed Under: emini SP500 (ES)

S&P 500 e-mini 6th April 2022

Posted on April 6, 2022 Written by Chart Prophet

Recent price action has been volatile with Significant Buyers and Sellers both active. Tuesday RTH, ES opened above 4572.5, see yesterday's pre-open notes, but quickly declined below that level and sold off from there. Weakness has continued … [Continue reading]

Filed Under: emini SP500 (ES)

S&P e-mini 5th April 2022

Posted on April 5, 2022 Written by Chart Prophet

Aggressive Buying was marked on Monday, see yesterday's notes. Early in yesterday's RTH there was a brief test of 4541.5 and ES rallied, again, see yesterday's notes. ST: Today I'm monitoring price relative to 4572.5. Time above that level … [Continue reading]

Filed Under: emini SP500 (ES)

S&P500 e-mini 4th April 2022

Posted on April 4, 2022 Written by Chart Prophet

Aggressive Selling (red) was marked on Thursday. New longs eliminated for me, at least until Significant Buying (green) is marked again. ST: I'm watching price relative to 4541.5 (4day). Time above that level would be the first positive at the … [Continue reading]

Filed Under: emini SP500 (ES)

S&P 500 e-mini 1st April

Posted on April 1, 2022 Written by Chart Prophet

Early in Thursday's RTH, ES couldn't manage a recovery above 4605 (see yesterday's notes on chart) and that minor sign of weakness played out late in the session with a decline below 4530. Aggressive Selling (red) was marked so new longs are … [Continue reading]

Filed Under: emini SP500 (ES)

S&P 500 e-mini below minor Resistance at RTH Open

Posted on March 31, 2022 Written by Chart Prophet

In the longer time-frame ES is in a strong position if it holds above the major Support at 4353. Mechanically, a RTH close below 4509.75, dashed line, Monday's Buying Day low, would be the first indication of weakness on this time-frame. In the … [Continue reading]

Filed Under: emini SP500 (ES)

S&P 500 30th March 2022

Posted on March 30, 2022 Written by Chart Prophet

The last six Value Areas were generated entirely above the 4447 Support. ES is in a strong position. Mechanically, a RTH close below 4509.75, dashed line, Monday's Buying Day low, would be the first indication of weakness. … [Continue reading]

Filed Under: emini SP500 (ES)

S&P 500 e-mini 29th March 2022

Posted on March 29, 2022 Written by Chart Prophet

Last five Value Areas were generated entirely above the 4447 Support. ES in strong position. Mechanically, a RTH close below 4509.75 (dashed line), Monday's Buying Day low, would be the first indication of weakness. … [Continue reading]

Filed Under: emini SP500 (ES)

S&P 500 e-mini holds strong position at the start of the week

Posted on March 28, 2022 Written by Chart Prophet

Last four Value Areas were generated entirely above the 4447 Support. ES in strong position. Mechanically, a RTH close below 4456 (dashed line on chart), Thursday's Buying Day low, would be the first indication of weakness. … [Continue reading]

Filed Under: emini SP500 (ES)

Rare pattern repeated in S&P 500

Posted on March 25, 2022 Written by Chart Prophet

Wednesday and Thursday repeated the rare pattern that we saw as recently as last week, i.e. a Significant Selling Day followed immediately by a Significant Buying Day. See previous comments on chart (highlighted). Last three occasions, the market … [Continue reading]

Filed Under: emini SP500 (ES)

  • « Previous Page
  • 1
  • …
  • 63
  • 64
  • 65
  • 66
  • 67
  • …
  • 538
  • Next Page »

Archives

Copyright © 2025 · Focus Pro Theme on Genesis Framework · WordPress · Log in