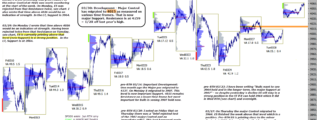
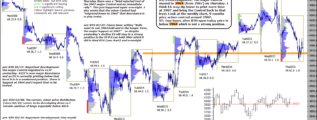
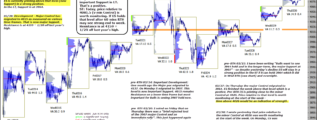
• Home

chartprofit.com

Daily analysis - Stock Market, Bonds, Forex and more

ES_F e-mini 6th February 2023

Posted on February 6, 2023 Written by Chart Prophet

Daily time-frame: as long as ES holds Support at 3989 it's in a strong position. ST: Last week price was rejected from the 4210 target (just below) with a chance of rejection here back to test 4063 see note 02/03. Time below that level and I would … [Continue reading]

Filed Under: emini SP500 (ES)

ES_F e-mini 3rd February 2022

Posted on February 3, 2023 Written by Chart Prophet

Daily time-frame: price action has been positive recently and as long as ES holds Support at 3989 its in a strong position. ST: Thursday RTH didn't quite make 4210 target, dotted line, but close enough. There is chance of rejection here back to … [Continue reading]

Filed Under: emini SP500 (ES)

ES_F e-mini 2nd February 2023

Posted on February 2, 2023 Written by Chart Prophet

The reduce risk point is now a RTH Close below 4048.50 (02/01 Buying Day Low) with LT Support at 3989. I'm targeting 4210 as per Monday's note. … [Continue reading]

Filed Under: emini SP500 (ES)

ES_F e-mini 1st February 2023

Posted on February 1, 2023 Written by Chart Prophet

ES is once again printing time above 4074, 3month VAH, which is a positive and suggests development to 4210. Possibly a volatile day today and repeating what I wrote in Monday's note - Mechanically, a RTH Close below 4027.25 (Thursday's Buying Day … [Continue reading]

Filed Under: emini SP500 (ES)

ES_F e-mini 31st January 2023

Posted on January 31, 2023 Written by Chart Prophet

On Friday ES probed above the 4074, 3month VAH, which I wrote could stall the rally. Monday's Value Area was lower but there's been plenty of positives recently. Repeating what I wrote in yesterday's note Mechanically, a RTH Close below 4027.25 … [Continue reading]

Filed Under: emini SP500 (ES)

ES_F e-mini 30th January 2023

Posted on January 30, 2023 Written by Chart Prophet

ES retracing today pre-RTH but last week's price action was strong and Friday's Value Area was above 4074, see Friday's note. Mechanically, a RTH Close below 4027.25 (Thursday's Buying Day Low) would indicate ST weakness and cutting back risk - … [Continue reading]

Filed Under: emini SP500 (ES)

ES_F e-mini 27th January 2023

Posted on January 27, 2023 Written by Chart Prophet

Price action so far this week has been positive. ES has now reached the minor VAH at 4074 which could stall the rally but time at this level or higher would be a further positive indication and suggest a new distribution higher has begun on the daily … [Continue reading]

Filed Under: emini SP500 (ES)

ES_F e-mini 26th January 2022

Posted on January 26, 2023 Written by Chart Prophet

ES found Resistance at the 4045 minor VAH, declined and then found Support just above the 3961 minor poc, see Tesday's note. Both those levels have now migrated higher. The minor VAH is now at 4074 and the poc Support moves to 3989. As noted on … [Continue reading]

Filed Under: emini SP500 (ES)

ES_F e-mini 24th January 2023

Posted on January 24, 2023 Written by Chart Prophet

ES has rallied to potential Resistance at 4045 which is the 2mn VAH. ST: If the price distribution that began 2 months ago is still developing then price may be rejected here with Support at 3961 but time at 4045 or higher would indicate a new … [Continue reading]

Filed Under: emini SP500 (ES)

ES_F e-mini 23rd January 2023

Posted on January 23, 2023 Written by Chart Prophet

On Friday I wrote…Price relative to that level (3927.0) is now very important to monitor, above/strong below/weak. Friday RTH opened slightly below 3927 and rallied immediately. Significant Buying (green) was marked. That's good price action. … [Continue reading]

Filed Under: emini SP500 (ES)

  • « Previous Page
  • 1
  • …
  • 65
  • 66
  • 67
  • 68
  • 69
  • …
  • 559
  • Next Page »

Archives

Copyright © 2026 · Focus Pro Theme on Genesis Framework · WordPress · Log in