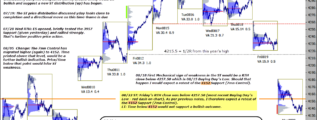
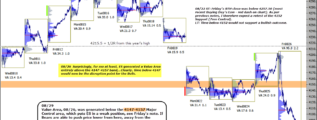
• Home

chartprofit.com

Daily analysis - Stock Market, Bonds, Forex and more

emini SP500 26th November 2021

Posted on November 26, 2021 Written by Chart Prophet

Big sell-off overnight. As I've been writing, a Value Area printed entirely below the 4672.50 would be a concern for the Bulls, and the first mechanical indication of weakness in the longer-term would be a RTH close below 4645.75 (dashed on chart), … [Continue reading]

Filed Under: emini SP500 (ES)

emini 24th November 2021

Posted on November 24, 2021 Written by Chart Prophet

ES needs to hold the 4672.50 Support. A Value Area printed entirely below that level would be a concern for the Bulls. First indication of weakness in the longer-term would be a RTH close below 4645.75 (dashed), 12th Nov Buying Day low. … [Continue reading]

Filed Under: emini SP500 (ES)

emini SP500 23rd November 2021

Posted on November 23, 2021 Written by Chart Prophet

Last five Value Areas have been printed entirely above 4672.50 - the First Support. That's a sign of strength. Today that Support was briefly tested after the RTH open and quickly rallied above 4690. First indication of weakness in the … [Continue reading]

Filed Under: emini SP500 (ES)

emini SP500 22nd November 2021

Posted on November 22, 2021 Written by Chart Prophet

Thursday's RTH briefly tested the First Support at 4672.50 and then immediately rallied, that's positive price action. Last four Value Areas have been printed entirely above that level. That's a sign of strength. First indication of weakness in the … [Continue reading]

Filed Under: emini SP500 (ES)

emini SP500 19th November 2021

Posted on November 19, 2021 Written by Chart Prophet

Thursday's RTH briefly tested the First Support at 4672.50 and then immediately rallied, that's positive price action, see Monday's comments. The 10dy has moved to 4689 and price relative tp that level is worth watching today. Last three Value … [Continue reading]

Filed Under: emini SP500 (ES)

emini SP500 18th November 2021

Posted on November 18, 2021 Written by Chart Prophet

Value Areas on Tue and Wed were printed entirely above 4672.50, the 6wk control. That's a sign of strength. First indication of weakness in the longer-term would be a RTH close below 4645.75 (dashed), Friday's Buying Day low. … [Continue reading]

Filed Under: emini SP500 (ES)

emini SP500 17th November 2021

Posted on November 17, 2021 Written by Chart Prophet

Tuesday's Value Area was printed entirely above 4672.50, the 6wk control. Comment from pre-RTH 10th Novemberwas "5day migrated lower to 4673.5…I'd want to see time printed back above that price before looking at new longs". First indication of … [Continue reading]

Filed Under: emini SP500 (ES)

emini SP500 16th November 2021

Posted on November 16, 2021 Written by Chart Prophet

Aggressive Buying (green) was marked on Friday. First indication of weakness would now be a RTH close below 4645.75 (dashed), Friday's Buying Day low. First Support is at 4672.50, the 6wk control. Sentiment: my version of the Rydex Assets Ratio … [Continue reading]

Filed Under: emini SP500 (ES)

emini SP500 15th November 2021

Posted on November 15, 2021 Written by Chart Prophet

Here's the positives from Friday's price action:Friday closed above the high of Wednesday's Selling Day.Red-at-bottom lows get re-tested abvout 80% of the time within 2 days. Wednesday's did not.Aggressive Buying (green) was marked.Enough time was … [Continue reading]

Filed Under: emini SP500 (ES)

emini SP500 12th November 2021

Posted on November 12, 2021 Written by Chart Prophet

On Wednesday more time early in RTH at 4673.5, the minor control, and then sold off. I marked Aggressive Selling (red) on Wed for first time since late September. Red-at-bottom lows get re-tested abvout 80% of the time within 2 days. As I wrote on … [Continue reading]

Filed Under: emini SP500 (ES)

  • « Previous Page
  • 1
  • …
  • 72
  • 73
  • 74
  • 75
  • 76
  • …
  • 538
  • Next Page »

Archives

Copyright © 2025 · Focus Pro Theme on Genesis Framework · WordPress · Log in