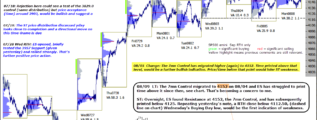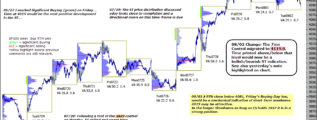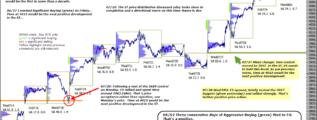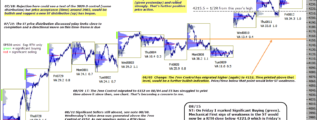
ST: On Friday I marked Significant Buying (green). Mechanical First sign of weakness in the ST would now be a RTH close below 4221.0 which is Friday's Buying Day Low. LT: Second sign of weakness would be time printed below 4152.0, the 7mn Control. … [Continue reading]