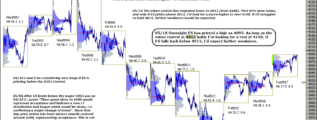
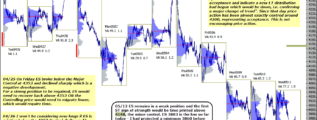
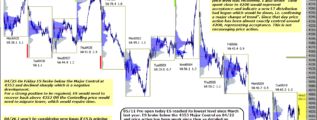
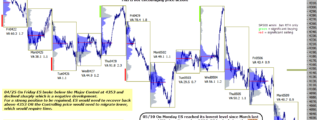
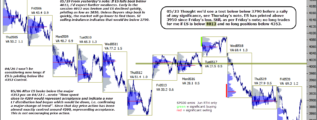
• Home

chartprofit.com

Daily analysis - Stock Market, Bonds, Forex and more

emini SP500 7th September 2021

Posted on September 7, 2021 Written by Chart Prophet

ST: Last six Value Areas have been generated entirely above 4483, the minor control, which is a positive in the ST. This is First Level Support. LT: The first sign of weakness in the LT would be a Value Area printed entirely below 4391.50, the … [Continue reading]

Filed Under: emini SP500 (ES)

emini SP500 3rd September 2021

Posted on September 3, 2021 Written by Chart Prophet

ST: Last five Value Areas have been generated entirely above 4483, the minor control, which is a positive in the ST. This is First Level Support. LT: The first sign of weakness in the LT would be a Value Area printed entirely below 4391.50, the … [Continue reading]

Filed Under: emini SP500 (ES)

emini SP500 2nd September 2021

Posted on September 2, 2021 Written by Chart Prophet

ST: Last four Value Areas have been generated entirely above 4483, the minor control, which is a positive in the ST. This is First Level Support. LT: The first sign of weakness in the LT would be a Value Area printed entirely below 4391.50, the … [Continue reading]

Filed Under: emini SP500 (ES)

emini SP500 1st September 2021

Posted on September 1, 2021 Written by Chart Prophet

ST: Friday's Value Area was generated entirely above 4483, the minor control, that was a positive in the ST. That level is now First Level Support. LT: The first sign of weakness in the LT would be a Value Area printed entirely below 4391.50, the … [Continue reading]

Filed Under: emini SP500 (ES)

emini SP500 31st August 2021

Posted on August 31, 2021 Written by Chart Prophet

ST: Friday's Value Area was generated entirely above 4483, the minor (15day) control, that was a positive in the ST. That level is now First Level Support. LT: The first sign of weakness in the LT would be a Value Area printed entirely below … [Continue reading]

Filed Under: emini SP500 (ES)

ChartProfit Chart Book week ending 27th August 2021

Posted on August 29, 2021 Written by Chart Prophet

ChartProfit Chart Book – week ending 27th August 2021 … [Continue reading]

Filed Under: emini SP500 (ES)

emini SP500 27th August 2021

Posted on August 27, 2021 Written by Chart Prophet

ST: in yesterday's RTH ES opened above 4483, the minor control, but very quickly broke that level, finding Resistance there later in the session, see yesterday's comments and chart. Price holding above 4483 would be the positive in the ST. LT: The … [Continue reading]

Filed Under: emini SP500 (ES)

emini SP500 26th August 2021

Posted on August 26, 2021 Written by Chart Prophet

ST: Last week there was a rejected test of the 2month control at 4391.50 and ES has rallied strongly from there. There is a minor (10day) control at 4483, useful to monitor price relative to that level for ST positional strength/weakness. LT: The … [Continue reading]

Filed Under: emini SP500 (ES)

emini SP500 25th August 2021

Posted on August 25, 2021 Written by Chart Prophet

ST: On Thursday last week there was a rejected test of the 2month control and ES has rallied strongly from there and yesterday price action consolidated Monday's gains. LT: The first sign of weakness in the LT would be a Value Area printed … [Continue reading]

Filed Under: emini SP500 (ES)

emini SP500 24th August 2021

Posted on August 24, 2021 Written by Chart Prophet

ST: Monday's RTH close was above 4450, Wednesday's Selling Day high, which negates any ST implications of that Aggressive Selling. LT: The first sign of weakness in the LT would be a Value Area printed entirely below 4391.50, the 2month … [Continue reading]

Filed Under: emini SP500 (ES)

  • « Previous Page
  • 1
  • …
  • 78
  • 79
  • 80
  • 81
  • 82
  • …
  • 538
  • Next Page »

Archives

Copyright © 2025 · Focus Pro Theme on Genesis Framework · WordPress · Log in