• Home

chartprofit.com

Daily analysis - Stock Market, Bonds, Forex and more

ES_F e-mini 18th August 2022

Posted on August 18, 2022 Written by Chart Prophet

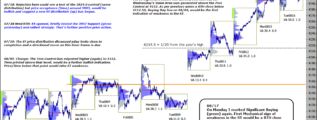
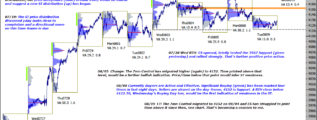
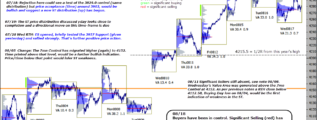
Buyers have been in control. Significant Selling (red) has been absent since 07/12. On Monday I marked Significant Buying (green) again. First Mechanical sign of weakness in the ST would be a RTH close below 4257.50 which is that Buying Day's Low. … [Continue reading]

Filed Under: emini SP500 (ES)

ES_F e-mini 17th August 2022

Posted on August 17, 2022 Written by Chart Prophet

On Monday I marked Significant Buying (green) again. First Mechanical sign of weakness in the ST would be a RTH close below 4257.50 which is that Buying Day's Low. Should that happen I would expect a retest of the 4152 Support (7mn Control). … [Continue reading]

Filed Under: emini SP500 (ES)

ES_F e-mini 16th August 2022

Posted on August 16, 2022 Written by Chart Prophet

ST: On Monday I marked Significant Buying (green) again. First Mechanical sign of weakness in the ST would now be a RTH close below 4257.50 which is that Buying Day's Low. LT: Second sign of weakness would be time printed below 4152.0, the 7mn … [Continue reading]

Filed Under: emini SP500 (ES)

ES_F e-mini 15th August 2022

Posted on August 15, 2022 Written by Chart Prophet

ST: On Friday I marked Significant Buying (green). Mechanical First sign of weakness in the ST would now be a RTH close below 4221.0 which is Friday's Buying Day Low. LT: Second sign of weakness would be time printed below 4152.0, the 7mn Control. … [Continue reading]

Filed Under: emini SP500 (ES)

ES_F e-mini 12th August 2022

Posted on August 12, 2022 Written by Chart Prophet

As per previous notes a RTH close below 4112.50, Buying Day low on 08/04, would be the first indication of weakness in the ST. In the ST, ES is today printing above 4215.5 which is the 1/2R off this year's high. I'm interested to see if that can … [Continue reading]

Filed Under: emini SP500 (ES)

ES_F e-mini 11th August 2022

Posted on August 11, 2022 Written by Chart Prophet

Significant Sellers still absent, see note 08/08. Wednesday's Value Area was generated above the 7mn Control at 4152. As per previous notes a RTH close below 4112.50, Buying Day low on 08/04, would be the first indication of weakness in the ST. … [Continue reading]

Filed Under: emini SP500 (ES)

ES_F e-mini 10th August 2022

Posted on August 10, 2022 Written by Chart Prophet

Tuesday's Value Area was generated entirely below 4152, see yesterday's note on chart. Bulls would want to see ES printing back above that level. from Monday's note, a RTH close below 4112.50, (dashed line on chart) Wednesday's Buying Day low, … [Continue reading]

Filed Under: emini SP500 (ES)

ES_F e-mini 9th August 2022

Posted on August 9, 2022 Written by Chart Prophet

LT: The 7mn Control migrated to 4152 on 08/04 and ES has struggled to print time above it since then, see chart. That's becoming a concern to me. ST: Overnight, ES found Resistance at 4152, the 7mn Control, and has subsequently printed below 4125. … [Continue reading]

Filed Under: emini SP500 (ES)

ES_F e-mini 8th August 2022

Posted on August 8, 2022 Written by Chart Prophet

Currently Buyers are Active and Effective. Significant Buying (green) has been marked four times in last eight days. Although ES generated a Value Area on Friday, entirely below the 7mn Control at 4152, the RTH close was high in the day's … [Continue reading]

Filed Under: emini SP500 (ES)

ES_F e-mini 5th August 2022

Posted on August 5, 2022 Written by Chart Prophet

Change: The 7mn Control has migrated higher (again) to 4152. Time printed above that level, would be a further bullish indication. Price/time below that point would infer ST weakness. … [Continue reading]

Filed Under: emini SP500 (ES)

  • « Previous Page
  • 1
  • …
  • 79
  • 80
  • 81
  • 82
  • 83
  • …
  • 562
  • Next Page »

Archives

Copyright © 2026 · Focus Pro Theme on Genesis Framework · WordPress · Log in