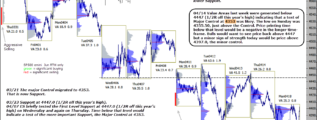
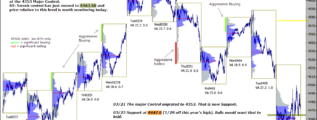
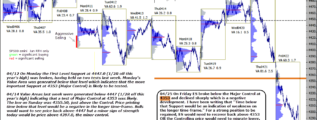
• Home

chartprofit.com

Daily analysis - Stock Market, Bonds, Forex and more

emini SP500 11th August 2021

Posted on August 11, 2021 Written by Chart Prophet

Last Wednesday's RTH found Support at 4391.50 (the 2mn controlling price). Value Areas since then have been generated above that level which is an indication of strength. First sign of weakness would be a Value Area printed entirely below 4391.50. … [Continue reading]

Filed Under: emini SP500 (ES)

emini SP500 10th August 2021

Posted on August 10, 2021 Written by Chart Prophet

Last Wednesday's RTH found Support at 4391.50 (the 2mn controlling price). Value Areas since then have been generated above that level which is an indication of strength. First sign of weakness would be a Value Area printed entirely below 4391.50. … [Continue reading]

Filed Under: emini SP500 (ES)

emini SP500 9th August 2021

Posted on August 9, 2021 Written by Chart Prophet

Wednesday's RTH found Support at 4391.50 (the 2mn controlling price). Value Areas from there have been higher. First sign of weakness would be a Value Area printed entirely below 4391.50. Significant Sellers (red) have not been marked for 34 … [Continue reading]

Filed Under: emini SP500 (ES)

ChartProfit Chart Book week ending 6th August 2021

Posted on August 8, 2021 Written by Chart Prophet

ChartProfit Chart Book – week ending 6th August 2021 … [Continue reading]

Filed Under: emini SP500 (ES)

emini SP500 6th August 2021

Posted on August 6, 2021 Written by Chart Prophet

Wednesday's RTH found Support at 4391.50 (the 2mn controlling price). Thursday's Value Area was higher and Aggressive Buying (green) was marked. First sign of weakness would be a Value Area printed entirely below 4391.50. Significant Sellers (red) … [Continue reading]

Filed Under: emini SP500 (ES)

emini SP500 5th August 2021

Posted on August 5, 2021 Written by Chart Prophet

Wednesday's RTH found Support at 4391.50 (the 2mn controlling price). First sign of weakness would be a Value Area printed entirely below that level. Significant Sellers (red) have not been marked for 32 days. Sentiment: On Friday, my version of … [Continue reading]

Filed Under: emini SP500 (ES)

emini SP500 4th August 2021

Posted on August 4, 2021 Written by Chart Prophet

First sign of weakness would be a Value Area printed entirely below 4391.50 (the 2mn controlling price). Significant Sellers (red) have not been marked for 31 days. Sentiment: On Friday, my version of the Rydex Assets Ratio reached 38.57, the … [Continue reading]

Filed Under: emini SP500 (ES)

emini SP500 3rd August 2021

Posted on August 3, 2021 Written by Chart Prophet

The 2mn has migrated higher again - up to 4391.50. First sign of weakness now would be a Value Area below that level. Significant Sellers (red) have not been marked for 30 days. Sentiment: On Friday, my version of the Rydex Assets Ratio reached … [Continue reading]

Filed Under: emini SP500 (ES)

emini SP500 2nd August 2021

Posted on August 2, 2021 Written by Chart Prophet

On 07/22 the 2mn moved to 4353.0. The last six value Areas have been generated entirely above that level which is a positive indication. First sign of weakness would be a Value Area below 4353. Significant Sellers (red) have not been marked for 29 … [Continue reading]

Filed Under: emini SP500 (ES)

emini 23rd July 2021

Posted on July 23, 2021 Written by Chart Prophet

Thursday's RTH session generated a Value Area entirely above 4340, the 1 month controlling price, and again, Aggressive Buying (green) was marked. A Value Area generated back below that level would weaken the current, strong, position. Sentiment: … [Continue reading]

Filed Under: emini SP500 (ES)

  • « Previous Page
  • 1
  • …
  • 80
  • 81
  • 82
  • 83
  • 84
  • …
  • 538
  • Next Page »

Archives

Copyright © 2025 · Focus Pro Theme on Genesis Framework · WordPress · Log in