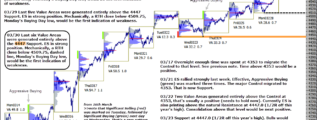
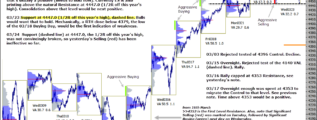
• Home

chartprofit.com

Daily analysis - Stock Market, Bonds, Forex and more

emini SP500 21st July

Posted on July 21, 2021 Written by Chart Prophet

Wednesday's Value Area was generated higher and time was spent above 4340, the 1 month Resistance, which puts ES back in a strong position if it can be held. Aggressive Buying (green) was marked again. A RTH close below 4326 (dashed), today's Buying … [Continue reading]

Filed Under: emini SP500 (ES)

emini SP500 21st July 2021

Posted on July 21, 2021 Written by Chart Prophet

Monday's Value Area was generated entirely below 4340 (1mn poc) which is a first sign of weakness on the longer timeframe, see previous comments. I want to see ES printing back above that level before looking at new longs but Aggressive Buying … [Continue reading]

Filed Under: emini SP500 (ES)

emini SP500 20th July 2021

Posted on July 20, 2021 Written by Chart Prophet

Monday's Value Area was generated entirely below 4340 (1mn poc) which is a first sign of weakness on the longer timeframe, see yesterday's comments. Before I can look at new longs now, ES has to recover that level or that controlling price migrates … [Continue reading]

Filed Under: emini SP500 (ES)

emini SP500 19th July 2021

Posted on July 19, 2021 Written by Chart Prophet

A Value Area generated entirely below 4340 (1mn poc) would be the first sign of weakness on the longer timeframe. Friday's VA didn't quite do it but today's might. Next level of important Support is 4163 (6mn). Sentiment: On 8th July, my version … [Continue reading]

Filed Under: emini SP500 (ES)

ChartProfit Chart Book week ending 16th July

Posted on July 17, 2021 Written by Chart Prophet

ChartProfit Chart Book – week ending 16th July 2021 … [Continue reading]

Filed Under: emini SP500 (ES)

emini SP500 16th July 2021

Posted on July 16, 2021 Written by Chart Prophet

I wrote that a RTH close below 4354.75, the low of Monday's Buying Day (dashed), would be the first indication of weakness. Thursday's RTH close was below that level (just) but again the Value Area on Thursday (like the previous four) was printed … [Continue reading]

Filed Under: emini SP500 (ES)

emini SP500 15th July 2021

Posted on July 15, 2021 Written by Chart Prophet

Last three Value Areas have been generated entirely above 4340 (1mn poc). ES is in a strong position if it prints above that level. Aggressive Buying (green) was marked on Monday. A RTH close below 4354.75, the low of that Buying Day (dashed), would … [Continue reading]

Filed Under: emini SP500 (ES)

emini SP500 14th July 2021

Posted on July 14, 2021 Written by Chart Prophet

Last three Value Areas have been generated entirely above 4340 (1mn poc). ES is in a strong position if it prints above that level. Aggressive Buying (green) was marked on Monday. A RTH close below 4354.75, the low of that Buying Day, would be the … [Continue reading]

Filed Under: emini SP500 (ES)

emini SP500 13th July 2021

Posted on July 13, 2021 Written by Chart Prophet

Value Areas on Friday and Monday were generated entirely above 4340 (1mn poc). ES is in a strong position if it prints above that level. Aggressive Buying (green) was marked again on Monday. A RTH close below 4354.75, the low of that Buying Day, … [Continue reading]

Filed Under: emini SP500 (ES)

emini SP500 12th July 2021

Posted on July 12, 2021 Written by Chart Prophet

Thursday’s RTH close was below 4318.50, the low of Friday’s Buying Day, (dashed). Mechanically that meant I needed to see Significant Buying (green) marked again before I could look at new longs again. On Friday ES recovered strongly and Significant … [Continue reading]

Filed Under: emini SP500 (ES)

  • « Previous Page
  • 1
  • …
  • 81
  • 82
  • 83
  • 84
  • 85
  • …
  • 538
  • Next Page »

Archives

Copyright © 2025 · Focus Pro Theme on Genesis Framework · WordPress · Log in