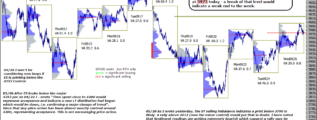
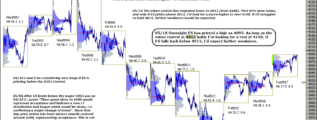
• Home

chartprofit.com

Daily analysis - Stock Market, Bonds, Forex and more

S&P500 e-mini 4th April 2022

Posted on April 4, 2022 Written by Chart Prophet

Aggressive Selling (red) was marked on Thursday. New longs eliminated for me, at least until Significant Buying (green) is marked again. ST: I'm watching price relative to 4541.5 (4day). Time above that level would be the first positive at the … [Continue reading]

Filed Under: emini SP500 (ES)

S&P 500 e-mini 1st April

Posted on April 1, 2022 Written by Chart Prophet

Early in Thursday's RTH, ES couldn't manage a recovery above 4605 (see yesterday's notes on chart) and that minor sign of weakness played out late in the session with a decline below 4530. Aggressive Selling (red) was marked so new longs are … [Continue reading]

Filed Under: emini SP500 (ES)

S&P 500 e-mini below minor Resistance at RTH Open

Posted on March 31, 2022 Written by Chart Prophet

In the longer time-frame ES is in a strong position if it holds above the major Support at 4353. Mechanically, a RTH close below 4509.75, dashed line, Monday's Buying Day low, would be the first indication of weakness on this time-frame. In the … [Continue reading]

Filed Under: emini SP500 (ES)

S&P 500 30th March 2022

Posted on March 30, 2022 Written by Chart Prophet

The last six Value Areas were generated entirely above the 4447 Support. ES is in a strong position. Mechanically, a RTH close below 4509.75, dashed line, Monday's Buying Day low, would be the first indication of weakness. … [Continue reading]

Filed Under: emini SP500 (ES)

S&P 500 e-mini 29th March 2022

Posted on March 29, 2022 Written by Chart Prophet

Last five Value Areas were generated entirely above the 4447 Support. ES in strong position. Mechanically, a RTH close below 4509.75 (dashed line), Monday's Buying Day low, would be the first indication of weakness. … [Continue reading]

Filed Under: emini SP500 (ES)

S&P 500 e-mini holds strong position at the start of the week

Posted on March 28, 2022 Written by Chart Prophet

Last four Value Areas were generated entirely above the 4447 Support. ES in strong position. Mechanically, a RTH close below 4456 (dashed line on chart), Thursday's Buying Day low, would be the first indication of weakness. … [Continue reading]

Filed Under: emini SP500 (ES)

Rare pattern repeated in S&P 500

Posted on March 25, 2022 Written by Chart Prophet

Wednesday and Thursday repeated the rare pattern that we saw as recently as last week, i.e. a Significant Selling Day followed immediately by a Significant Buying Day. See previous comments on chart (highlighted). Last three occasions, the market … [Continue reading]

Filed Under: emini SP500 (ES)

S&P 500 e-mini Support held on Wednesday

Posted on March 24, 2022 Written by Chart Prophet

Support (dashed line on chart) at 4447.0, the 1/2R off this year's high, was not convincingly broken, so yesterday's Selling (red) has been ineffective so far. … [Continue reading]

Filed Under: emini SP500 (ES)

S&P 500 e-mini 23rd March 2022

Posted on March 23, 2022 Written by Chart Prophet

Support at 4447.0 (1/2R off this year's high), dashed line on chart. Bulls would want that to hold. Mechanically, a RTH close below 4379, the low of the 03/18 Buying Day, would be the first indication of weakness. … [Continue reading]

Filed Under: emini SP500 (ES)

S&P 500 in stronger position

Posted on March 22, 2022 Written by Chart Prophet

and testing next Resistance level Last two Value Areas were generated entirely above the Control at 4353, that's usually a positive (needs to hold now). Currently ES is also printing above the natural Resistance at 4447.0 (1/2R off this year's … [Continue reading]

Filed Under: emini SP500 (ES)

  • « Previous Page
  • 1
  • …
  • 84
  • 85
  • 86
  • 87
  • 88
  • …
  • 559
  • Next Page »

Archives

Copyright © 2026 · Focus Pro Theme on Genesis Framework · WordPress · Log in