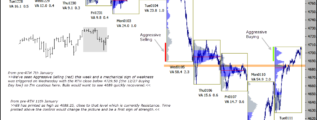
• Home

chartprofit.com

Daily analysis - Stock Market, Bonds, Forex and more

emini SP500 19th May 2021

Posted on May 19, 2021 Written by Chart Prophet

The 3mn controlling price at 4163.0 has capped the upside this week. On Tuesday there was a RTH close below 4135, Friday's Buying Day low, and this an indication of weakness, see yesterday's comments. As written at the start of the week, a Value Area … [Continue reading]

Filed Under: emini SP500 (ES)

emini SP500 18th May 2021

Posted on May 18, 2021 Written by Chart Prophet

The 3mn controlling price at 4163.0 capped the upside on Monday. A Value Area generated above that level would be bullish. A RTH close below 4135, Friday's Buying Day low, would now be first indication of weakness. Sentiment: My version of the … [Continue reading]

Filed Under: emini SP500 (ES)

emini SP500 17th May 2021

Posted on May 17, 2021 Written by Chart Prophet

The 3mn controlling price has migrated lower to 4163.0. Price relative to that level is now important to monitor. A Value Area generated above 4163 would be bullish. Pre-open ES is printing below that point. Aggressive Buying (green) was marked on … [Continue reading]

Filed Under: emini SP500 (ES)

ChartProfit Chart Book week ending 14th May 2021

Posted on May 16, 2021 Written by Chart Prophet

ChartProfit Chart Book - week ending 14th May 2021 … [Continue reading]

Filed Under: emini SP500 (ES)

emini SP500 14th May 2021

Posted on May 14, 2021 Written by Chart Prophet

ES needs to recover 4181 before I look at new longs. That controlling price could migrate (best guess would be to 4122.5 or 4135.5) and that would change things. Next big Support is at 3897. Sentiment: My version of the Rydex Assets Ratio was … [Continue reading]

Filed Under: emini SP500 (ES)

emini SP500 13th May 2021

Posted on May 13, 2021 Written by Chart Prophet

ES needs to recover 4181 before I look at new longs. That controlling price could migrate (best guess would be to 4122.5) and that would change things. Next big Support is at 3897. Sentiment: My version of the Rydex Assets Ratio was higher at … [Continue reading]

Filed Under: emini SP500 (ES)

emini SP500 12th May 2021

Posted on May 12, 2021 Written by Chart Prophet

Tuesday's RTH Value Area was generated entirely below 4181, see yesterday's comments. That level needs to be recovered before I look at new longs. It could migrate (best guess would be to 4122.5) and that would change things. Next big Support is at … [Continue reading]

Filed Under: emini SP500 (ES)

emini SP500 11th May 2021

Posted on May 11, 2021 Written by Chart Prophet

Aggressive Selling was marked on Monday (red) and mechanically that eliminates new longs, at least until Significant Buying is marked again (green). ES auctioned down to First Level Support at 4181 in RTH. Overnight, time has been printed below that … [Continue reading]

Filed Under: emini SP500 (ES)

emini SP500 10th May 2021

Posted on May 10, 2021 Written by Chart Prophet

Mechanically I'm staying bullish with the trend but that would change with a RTH close below 4117.50 (dotted line), the low of the most recent Buying Day. That level would move higher if there is a further Buying Day. In the ST the 1mn Support is … [Continue reading]

Filed Under: emini SP500 (ES)

ChartProfit Chart Book week ending 7th May 2021

Posted on May 9, 2021 Written by Chart Prophet

ChartProfit Chart Book - week ending 7th May 2021 … [Continue reading]

Filed Under: emini SP500 (ES)

  • « Previous Page
  • 1
  • …
  • 86
  • 87
  • 88
  • 89
  • 90
  • …
  • 538
  • Next Page »

Archives

Copyright © 2025 · Focus Pro Theme on Genesis Framework · WordPress · Log in